During the last months we released a couple of major features in Sonargraph that allowed easier interaction like the ‘Architectural View’ and improved the interpretation of results like the ‘System Diff’, ‘Quality Gates’ or ‘Issue Ranking’. We have described the power of these features in individual blog posts.
Some implemented improvements are less obvious, but nevertheless can have a big impact while working with Sonargraph.
This blog post highlights four hidden gems that the casual Sonargraph user might not know about:
- Improved issue to resolution matching
- Filtering in tables
- Visualizing cycle croups in Exploration view
- Passing selection between Sonargraph and Eclipse IDE
Improved Issue to Resolution Matching
To me, among the list of improvements discussed in this blog post, the most important is the improved issue to resolution matching. Let me first describe the problem:
Sonargraph provides the functionality to “resolve” detected issues, by either marking them as “ignored” or defining a “fix” task. These resolutions are persisted and re-applied everytime the system is refreshed. To match defined resolutions with the correct issues, the issue type and the fully qualified name (ID) of the affected element is stored with the resolution.
This is straight forward for simple issues like threshold violations, where the element either still exists or not.
It gets more complicated with what we call “composite issues” like cycle groups and duplicate code blocks that involve several elements.
These issues do not have stable names. What is called “Duplicate Code Block 1” might be called “Duplicate Code Block 11” by Sonargraph next week. The numbers are provided by the Sonargraph analysis in the order that the problems are detected in the code. Obviously, this order might change if new duplicates are introduced or existing ones are fixed.
In the past, hash values for the duplicated text of each block were created and used to match issues against resolutions. The matching of cycle groups was done similarly, where the fully qualified names of the involved elements were used. So, when a change occurred to one of the involved elements, e.g. a source file or namespace was renamed, a resolution (“Fix” task or “Ignore”) would no longer be matched and be flagged as “non applicable” by Sonargraph.
In an ideal world, where enough time exists to strictly follow the “boyscout rule” and clean up the code when it is modified, this is good enough. But, this is rarely the case and a lot of good reasons exist to rather only modify what is needed. Of course, it is annoying having to re-create resolutions just because the code base changed.
With the implementation of the “System Diff” functionality, it became even more apparent that this approach of matching resolutions and issues was not sufficient. For the “System Diff” not only the issue to resolution matching is relevant, but also issues from the baseline need to be matched to currently identified issues, so that not only added and removed issues are detected, but also if an issue was improved or worsened, e.g. that a cycle group got improved by reducing the number of involved elements.
Thus, we desperately needed a better way to match issues, one that would tolerate some modification of the involved elements.
Implementation
We added SCM (Source Control Management) analysis to Sonargraph, so that change frequency of files is available as a metric. Up to now, we do not investigate changes in depth to detect move or rename operations, so that information is not available during issue matching. Plus, we do not want to force the SCM analysis as a requirement on our users.
Since unique identifiers of involved elements exist in composite issues as a string representation, the solution boils down to find best matching strings. Cycle groups are matched, if at least 60% of their involved elements match. For duplicate code blocks, we implemented a solution that is based on the edit-distance of strings.
The edit-distance approach is also used for matching issues created by scripts for a specific line, e.g. //FIXME comments. Not only the hash value of the affected line is stored. Additionally, the context of the line, i.e. three lines above and below are hash encoded and used as context-info during the match. Thus, now it is a lot less likely that the same FIXME comment earlier in a file will be matched by a resolution as it was the case before.
This all leads to more stable resolutions that do not lose the connection to the associated issues just because of minor modifications in the code.
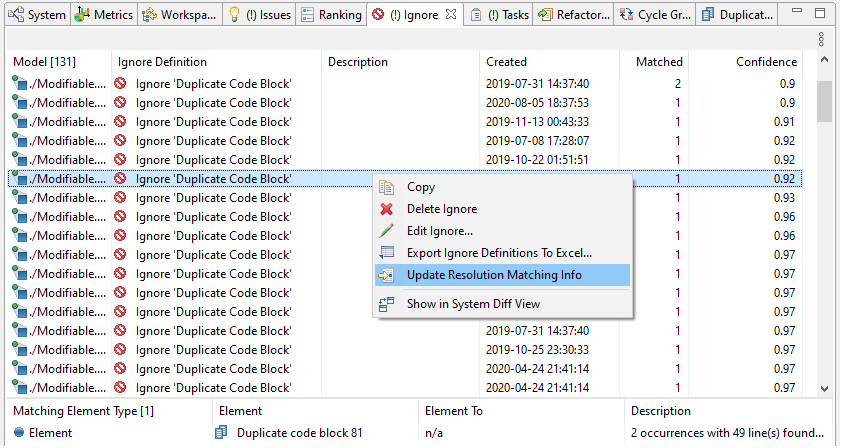
The “Ignore” and “Task” views contain an additional column “Confidence” that shows how accurate the resolution info still matches the issue. Anything below 1.0 indicates that the code has changed since the resolution has been created. Those entries can be investigated and checked if the resolution still applies. The resolution’s matching info can easily be updated via the context menu as shown in the screenshot below. If you keep your Sonargraph system in the version control system (which we highly recommend), you can see the changed hash values, since all info about the Sonargraph system is kept in plain text files.
Filtering of Tables
At a lot of places, Sonargraph uses tables to show information. The number of items can be high, for example the number of issues or the number of metric values on source file level. Thus, finding the information of interest can be hard, for example if you want to check some metrics for all source files in a “controller” package.
For this reason, we implemented a filter widget that is available in all table viewers and which can be activated via Ctrl+Shift+f. Right after activation the focus is set into the filter box, so you can immediately start typing and hit return to apply the filter. As with other filters, the background of the view changes to yellow to indicate that not all information is displayed.
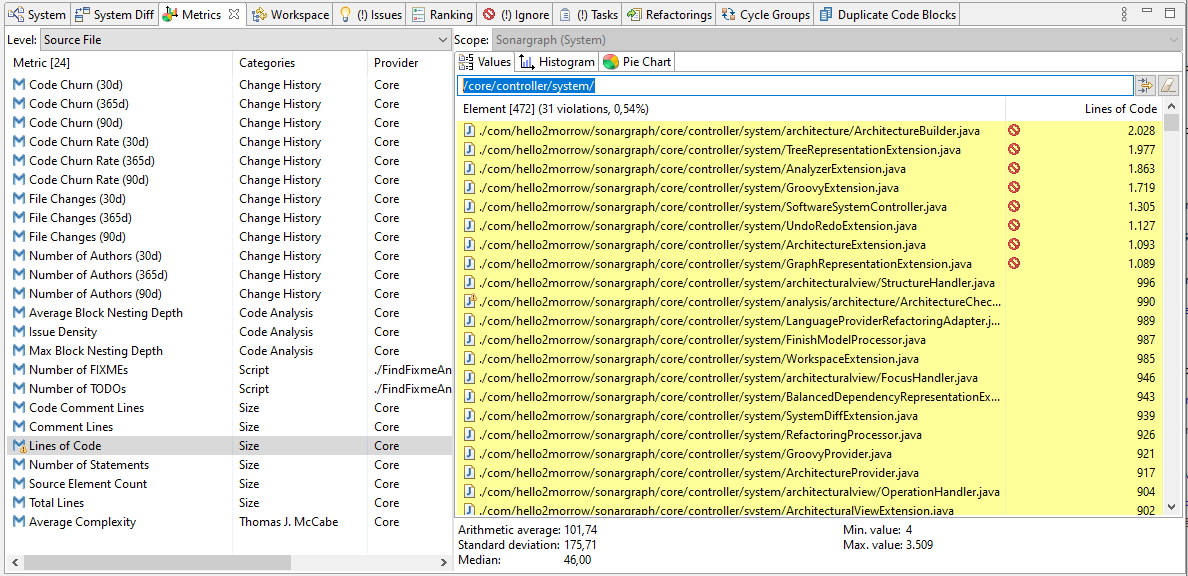
The filter currently checks in all columns of a row for a match of the searched text. This is simple, but already quite powerful to quickly narrow down the provided information.
Pressing the ESC key, the filter is removed and the table again shows all items.
Visualizing Cycle Groups in Exploration View
The Cycle Group view is great for visualizing the entanglement produced by a cycle group. The Cycle Breakup view can be opened from the Cycle Group view and used to find the best options where dependencies should be removed. But the Cycle Group view is less practical for identifying misplaced elements and finding the right targets for move refactorings because it does not allow a drill-down to types or methods.

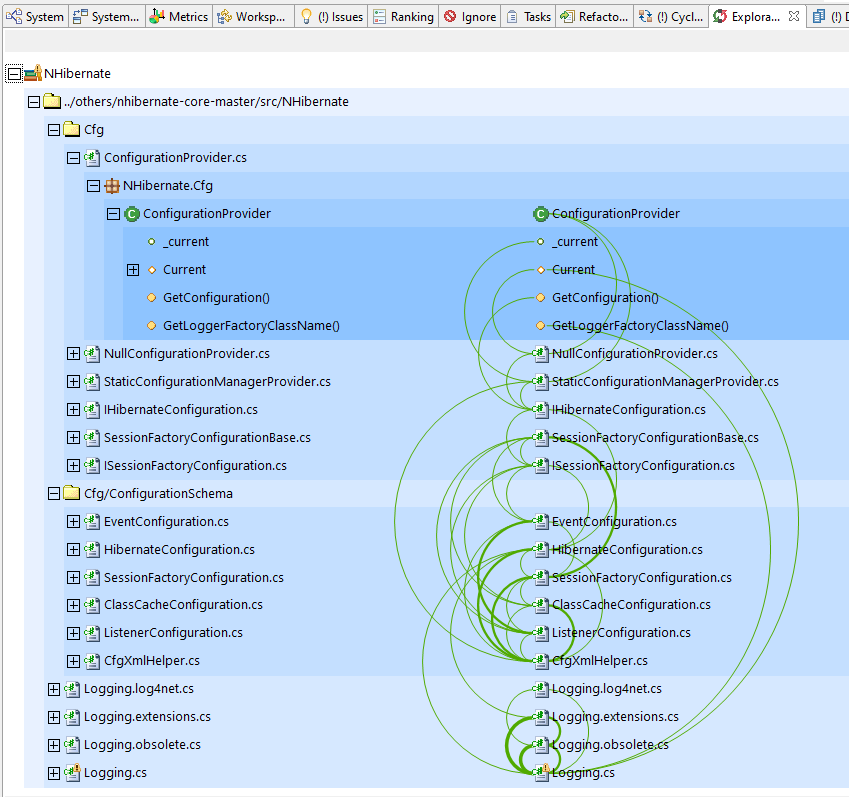
For this reason, the cycle group can also be visualized in the Exploration view.
Since the Exploration view applies a layering according to number of incoming and outgoing dependencies, it is pretty easy to spot dependencies on the right side that go upward. You can trace the dependencies down to the class and further down to method and field level, so it is much better to identify misplaced elements and/or unintended dependencies.
Passing Selection between Sonargraph and Eclipse IDE
If you are analyzing the system with Sonargraph and are actively programming, it is often required to switch between Sonargraph and the IDE. Sonargraph as well as the IDE both offer search functionalities to locate elements, but it is still a hassle to identify the same element and then move to the same location in a file.
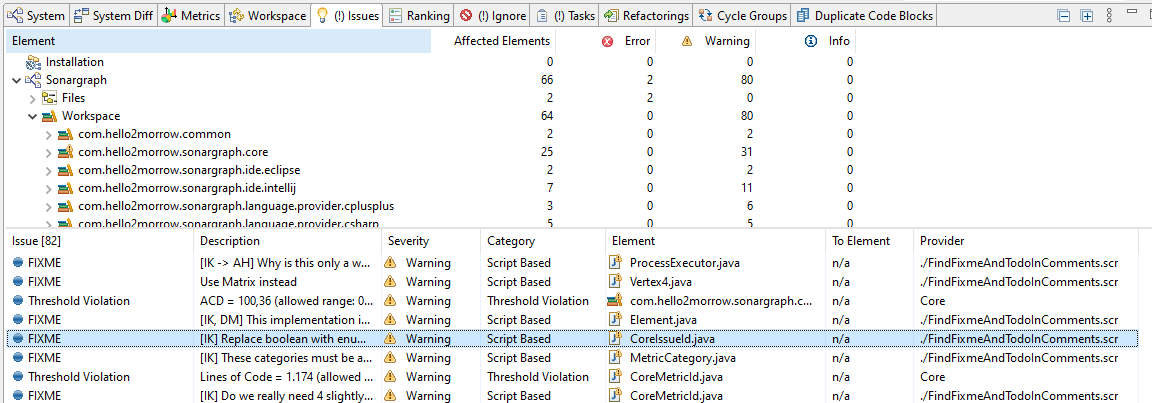
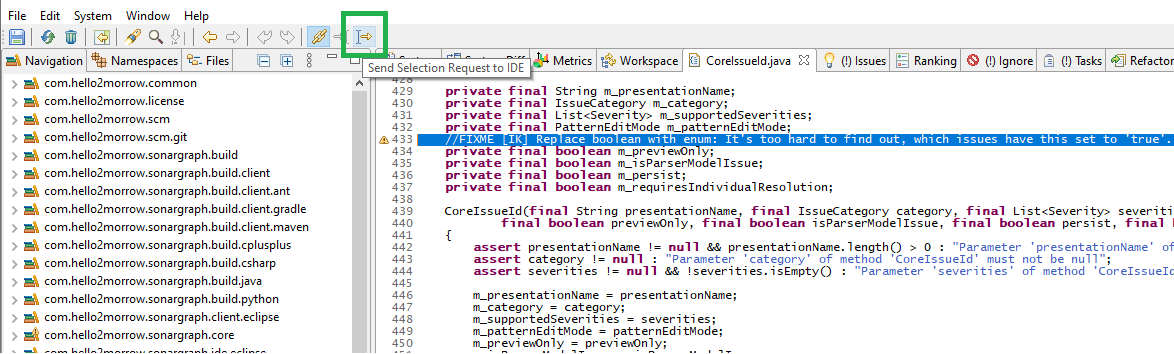
To make this easier, we implemented a remote selection mechanism that passes the information to the other end via HTTP. Thus, if you see something strange during the analysis in Sonargraph that you want to fix right away, click on the toolbar item to send the current selection, switch to Eclipse and hit the “reveal” toolbar item there. This is illustrated by the following three screenshots, where first a “FIXME” is selected in the Issues view, the issue is further investigated in Sonargraph’ Source view by double-clicking it (1) and then the selection is sent to the Eclipse IDE via the toolbar icon (2). If the Sonargraph Eclipse plugin is installed and active, the selection request can be revealed simply by clicking on the highlighted toolbar icon (3). The source file is opened and the same line is highlighted, allowing to start coding right away.

It works similarly the other way around: Whatever you have selected in Eclipse, if you send the selection request to Sonargraph and hit “reveal” in the toolbar, Sonargraph will select that element in the Navigation view. Via the context menu, all advanced dependency viewers are at your fingertips, so it is very straightforward to see how that element connects to the rest of the system. This feature is currently only available in Sonargraph Architect not Sonargraph Explorer.
Summary
This blog post highlighted four usability improvements that we implemented for Sonargraph during the last couple of months.
The “fuzzy” resolution matching makes the efforts spent on resolutions a lot more stable. The other three features make working with Sonargraph easier, reducing the required manual interactions and simply make the provided information more actionable.
As a result, it is more fun to work with Sonargraph.
Tell us what you think!