Using Sonargraph to analyse a large code base usually reveals a lot of issues. The “System Diff” helps to keep the quality level by highlighting new and worsened issues as described in a previous blog post. But up to now there has been no recommendation about which of the already existing issues should be fixed first.
The new “Ranking” view available in Sonargraph 11.5 does exactly that and this blog post describes how it works.
“I have two kinds of problems, the urgent and the important. The urgent are not important, and the important are never urgent.”
Dwight D. Eisenhower
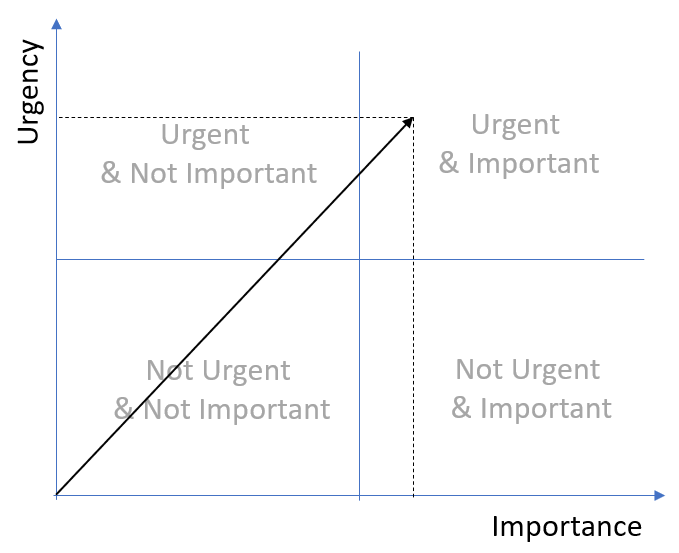
This quote is attributed to Dwight D. Eisenhower and is the basic principle of the “Eisenhower Method” to classify tasks by putting them into one of four buckets “Important and Urgent”, “Not Important and Urgent”, “Important but not Urgent” and “Not Important and not Urgent”.
Rotating the standard representation of the “Eisenhower Matrix” and treating “urgency” and “importance” as dimensions, the distance from origin can be treated as the “score” or “relevance” of an issue and this value can be used to sort them globally.
The algorithm to determine the numeric value for “importance” is based on the severity (warning, error), issue type (architecture violation, cycle group, threshold violation, …) and its impact (number of cyclic elements, how much has a threshold been violated, number of duplicated lines, …).
The algorithm to determine the numeric value for “urgency” is based on the idea that more recently introduced problems are easier to fix, since the context is still present on the developers’ minds. This information is provided by the “System Diff” analysis.
Likewise, the number of changes and the code churn (changed lines) are a good indicator if the development is affected by the issue. It is not worth spending efforts on code that has not been touched for a year. The more a file has changed and the more developers have been involved, the larger is the risk of new bugs being introduced and the larger is therefore the benefit of a fast fix. This correlation is explained very well in “Your Code as a Crime Scene” by Adam Tornhill. Metric values for number of authors, number of commits, code churn for three periods (30 days, 90 days, 365 days) are provided by the SCM analysis.
Additionally, an “ease of fix” value is computed. The “ease of fix” value is high, if a cycle group requires only a few parser dependencies to be removed. Cycle groups tend to grow and tighten over time, so it is essential to fix them early. Similarly, if code has been duplicated and the copies are still identical, it is easier to extract a shared method/class. Once each occurrence has been individually modified, it becomes more difficult to find out which lines should be the same but are not and which really need to be different.
How individual factors contribute to the score is of course influenced by our priorities. We think that for the maintainability and extensibility of a software, the architecture and structural quality of the code base is very important. Therefore, architecture violations and cycle groups get a boost via the “Issue Category” factor. Transparency is important, so the algorithm can be inspected “at work” as described next.
Real World Example
Analysing the Java code of the Jenkins CI server reveals that the project contains around 134 000 lines of code (LOC), excluding comment and blank lines. With only two metric thresholds configured for LOC (on source file level) and “Modified Cyclomatic Complexity” (on method level) there are 60 identified issues.
Opening the “Ranking” view, the cycle group issues are scored really high in comparison to the other issues as shown in the screenshot below.
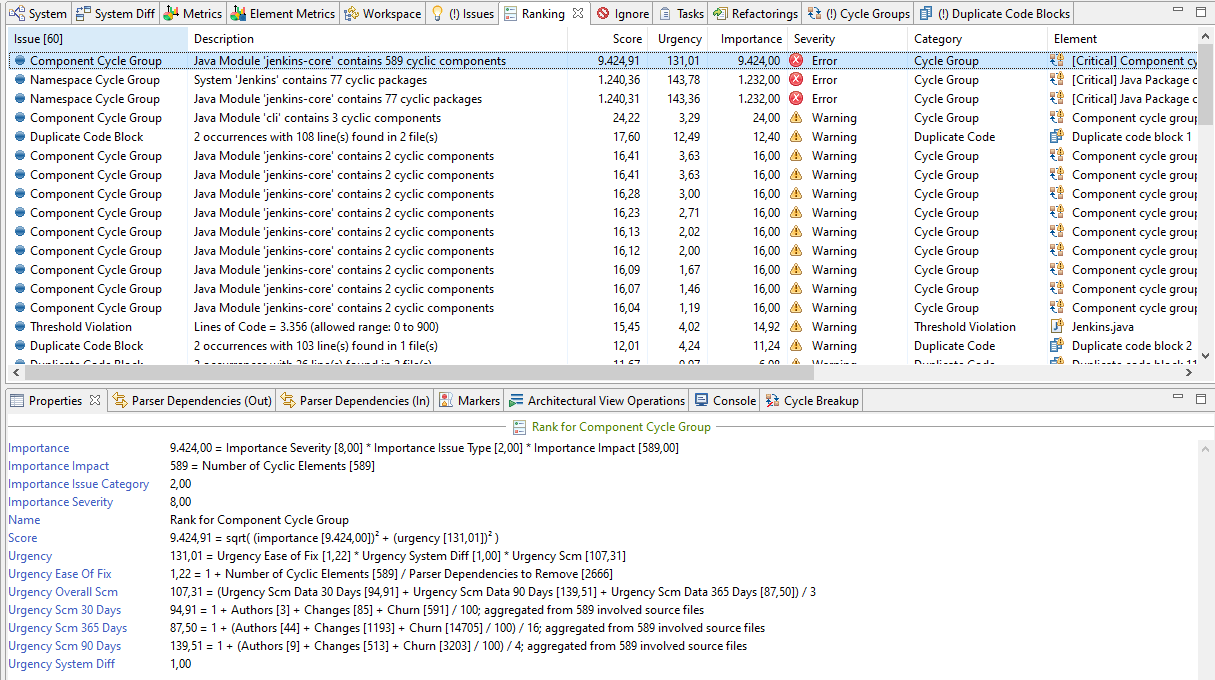
Looking at the information in the “Properties” view, the reason becomes clear. The impact of these cycle groups on the whole system is huge. The component cycle group involves 589 out of 1337 files (44%), the namespace cycle group involves 77 packages out of 98 (79%) and dependencies of 884 involved files (66%).
You are not convinced that cycle groups are a problem? Opening the namespace cycle group in the “Exploration” view shows how the packages depend on each other. To me this looks very much like a “big ball of mud” and certainly makes it difficult to understand the overall architecture. (Side note: We see this kind of structural decay very often in projects that do not check for cyclic dependencies, so this does not come as a surprise.)
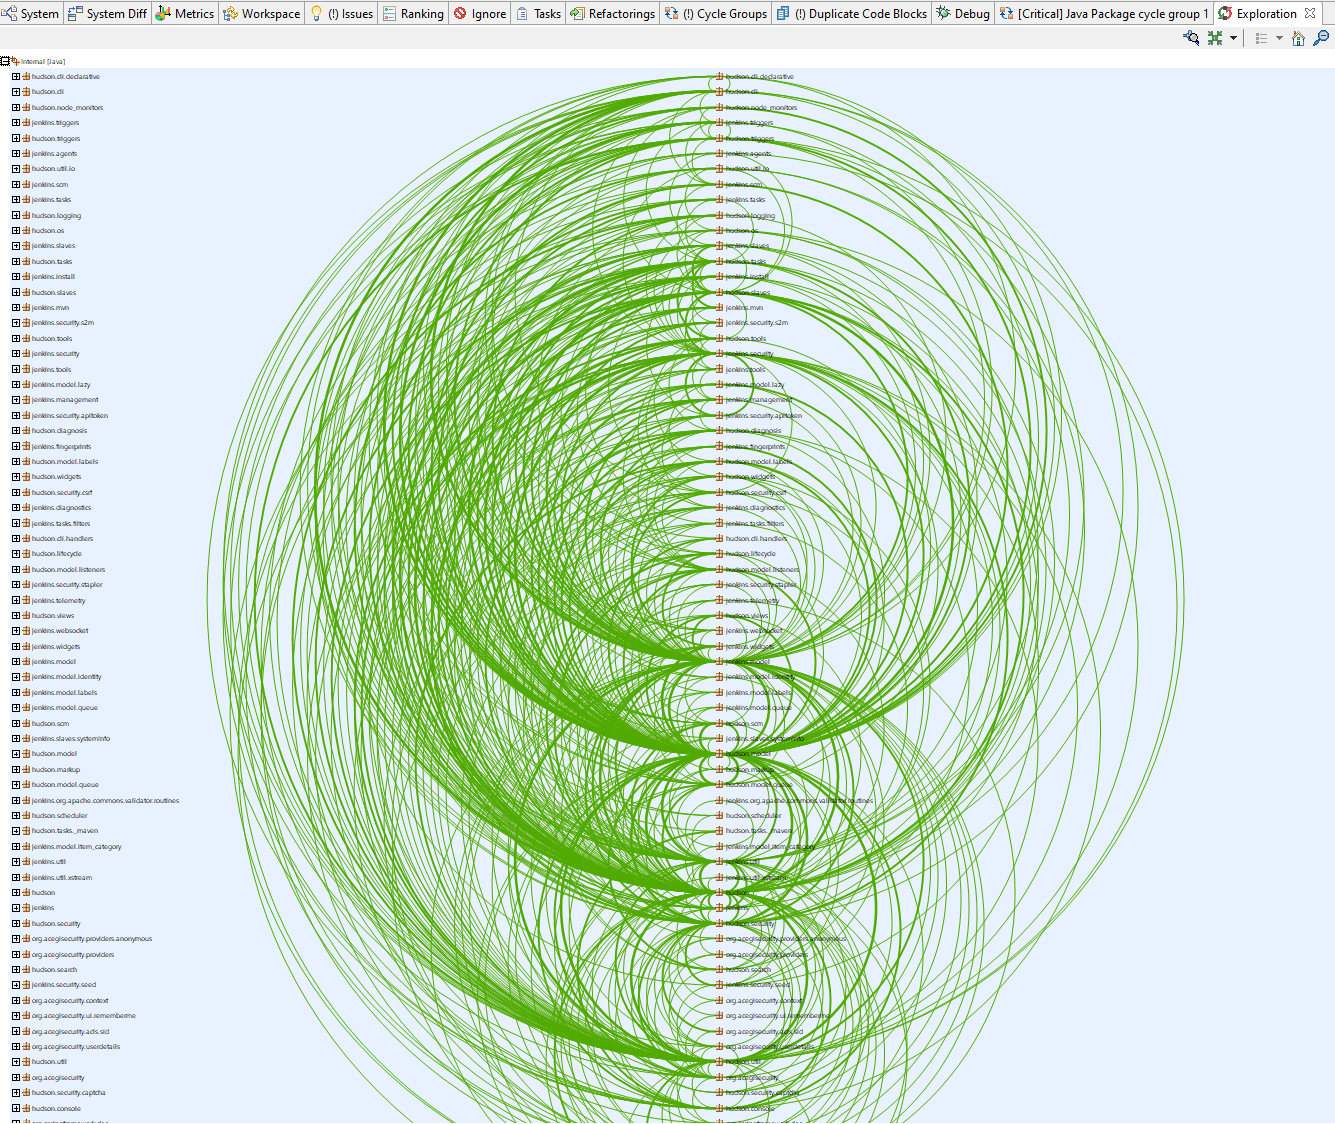
Unfortunately, a fix is not simple, as there are thousands of parser dependencies involved. The recommended approach is to define an architecture first, so that it becomes clear, which dependencies need to be removed, and then gradually split the cycle into smaller parts.
Navigating down the list of issues, one duplicate code block has a high score, because the two existing occurrences are identical twins and the “ease of fix” value is at the maximum for duplicate code blocks.
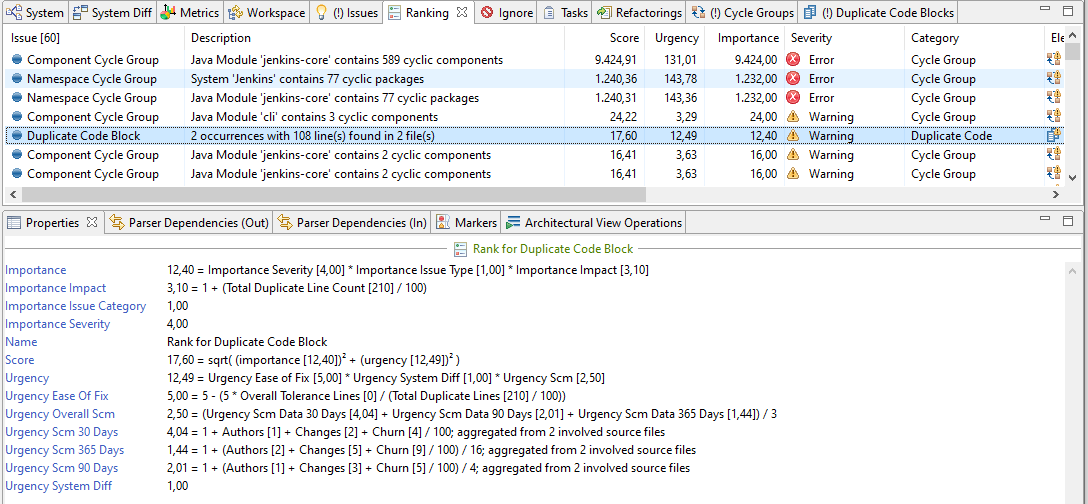
Looking at it in the “Duplicate Code Block” view, it seems to be a low-hanging fruit indeed. Even though the two classes don’t share a direct parent, the main logic of the method “createListener()” looks like it could be extracted and the necessary info passed in as parameters.

If you want to start fixing issues that don’t require a lot of system knowledge you can start fixing file-local threshold violations like splitting up huge files or methods.
Like other table-based viewers, the “Ranking” view supports filtering. The filter widget is activated via the shortcut Ctrl+Shift+f (and deactivated via Esc). The ranked threshold violations of the Jenkins code base appear as shown in the screenshot.
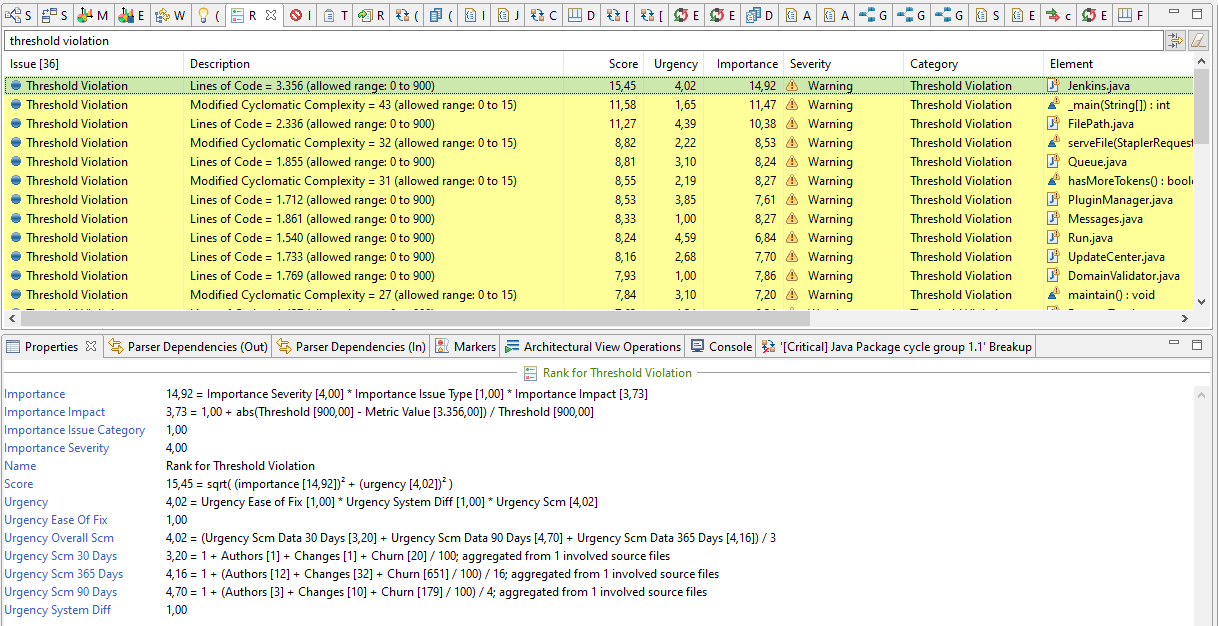
On top is the file “Jenkins.java” with over 3356 LOC (excluding comment and blank lines). It contains 2,5% of all Java code, 33 times more than the average file LOC.
A treemap can be used for cross-checking, if this is one of the most changed files. And indeed, this file is among the ones with the highest number of authors and the highest number of code churn during the last year. Splitting it up will certainly reduce the risk of merge conflicts amongst other positive effects.

Summary
This blog post described the implementation of a scoring algorithm based on the ideas of the “Eisenhower Method”. The algorithm balances “importance” and “urgency” dimensions of issues to identify those with a high relevance. Refactoring efforts are best spent in fixing these issues first. The “Ranking” view of Sonargraph shows the scored issues and the “Properties” view provides details about how the score has been calculated. The results have been discussed using a real-world code base. From an outsider’s perspective the top-ranked issues are indeed very relevant to be fixed.
This is a brand new feature of Sonargraph, so you can expect a bit of fine-tuning of the algorithm in the future. Let us know, if the ranking matches your intuition. Feedback is very welcome!