I thought I’d use our new 3D city view visualizations to have a closer look at Apache-Cassandra, a very popular and successful open source project that implements a NoSql database. I know from previous analysis runs of the same software that it already had problems with structural erosion. Years ago I analyzed Cassandra 1.2.6 and found pretty big cycle groups for Java files as well as for packages. Maintainability Level was only 9.4% (everything under 50% is concerning) while the metric “Propagation Cost” has a value of 62%. That means that every change will affect 62% of all code directly or indirectly which also is not a good thing because it significantly increases the chance of regression bugs.
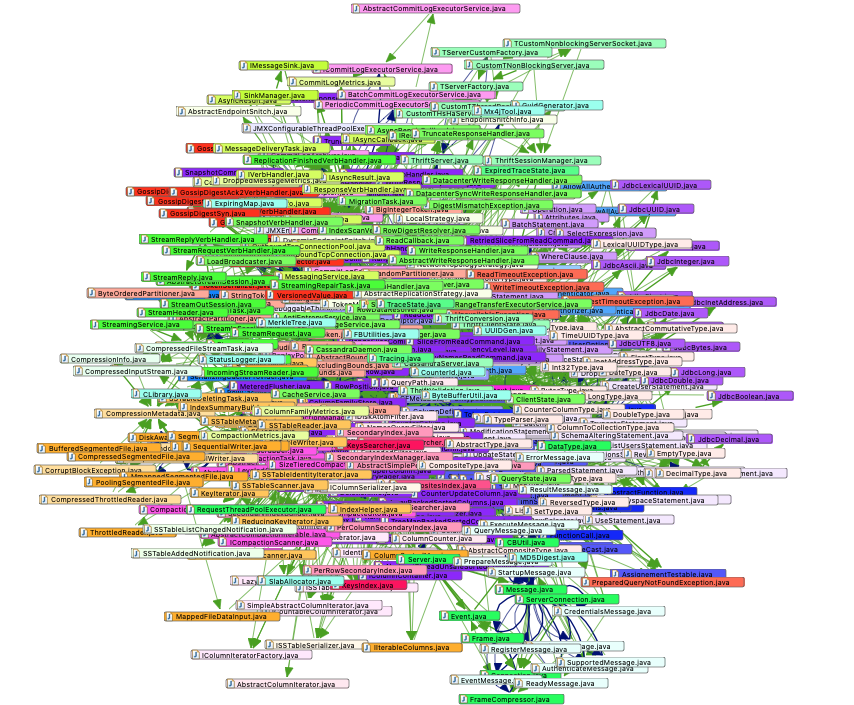
Before you say “this image is useless, you cannot see anything there” let me tell you that I agree. The point is to make sure that your software never ends up in that situation. This big cyclic conglomeration is making it close to impossible to modularize Cassandra or to put any kind of architectural model on top of it.
Let me clarify that this article is not meant to bad mouth the developers of Cassandra. They did a good job in creating a very successful NoSql database that supposedly works quite well. So if this is the case , why bother about those metrics and the loss of architectural cohesion? Well, they actually affect maintainability and comprehensibility of the code. High coupling means developers will need to read a lot of code before they can make changes. If your code is modular and properly decoupled, changes and new features will become a lot easier to implement. On the other hand, if your code is tangled like in this example it will be harder to grow your developer team, because it will take quite some time for new developers to familiarize themselves with the code base. It is also more stressful and less fun to work on code like that. On top of that it is actually quite hard to keep a code base well structured, especially when many people are working on it. You need tools like Sonargraph (the tool I use for this analysis) or ArchUnit to define and enforce architectural boundaries, and you should start with that early in your project.
Now of course I was curious to see if things got any better over the last couple years. What usually happens in those cases is that the overall coupling will only get worse while the number of cyclic elements grows until more or less your whole code base has been eaten by it. (This is the reason why I like to refer to that as “Code Cancer”) So my working hypothesis for now is that it got worse. Let’s have a closer look and introduce the powerful software city visualization:
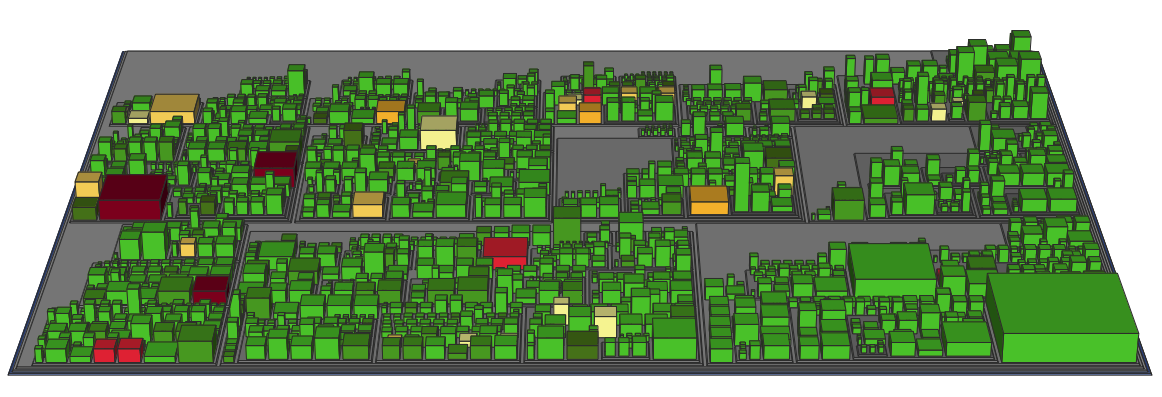
Here each source file is represented as a building. The building footprint is proportional to the size of the file in LoC, the building height is driven by complexity (in this example it is average indentation depth) and the color is derived from the code churn of that particular file within the last 365 days. (Code churn adds up added and removed lines in commits to your version control system)
You should notice a dark red building on the left, that has a relatively large footprint. If I hover over it with the mouse it will show me in a tooltip, that this is class StorageService with 4,490 lines of code and a code churn of 949 lines within the last 365 days. So you could say that about 20% of the class have been rewritten or changed in the last year. It also was committed more than 40 times in a year, so almost one commit per week. The complexity of the class seems to be okay, because the building is not very high. But a large class that needs to be touched often is what we call a hotspot. This class is likely a God class, a class that has a lot of incoming and outgoing dependencies and thereby increases coupling and hinders modularization. Let us double check that:
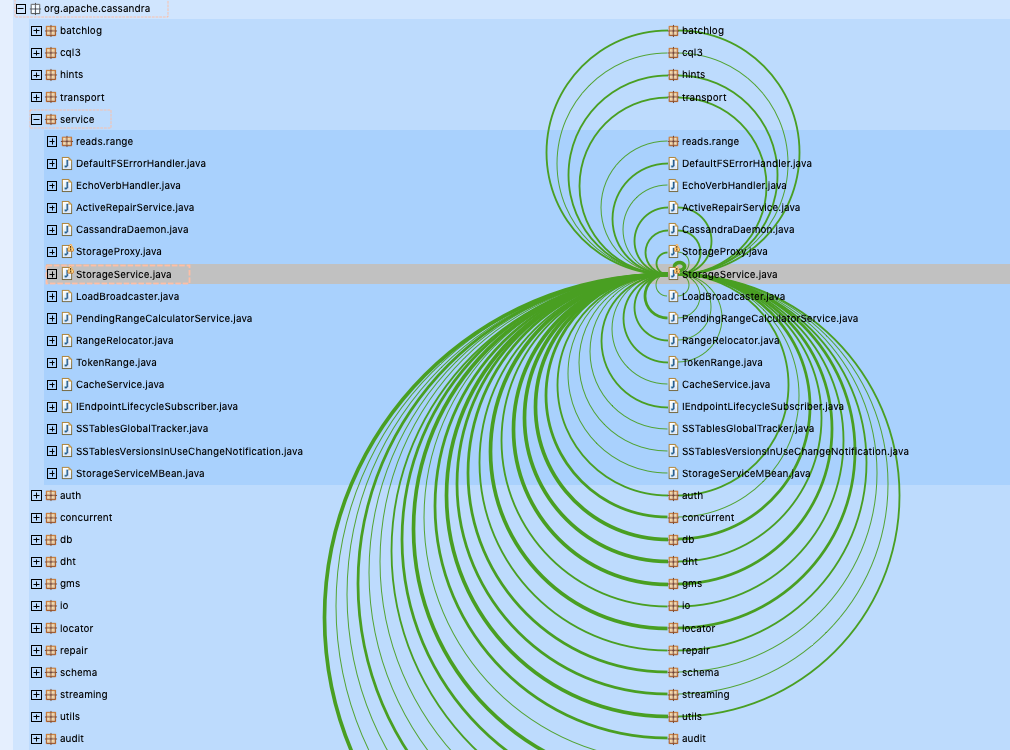
So that was easy to confirm. Arcs on the left always go top down while arcs on the right go bottom up. So the outgoing dependencies of storage service are in the bottom left and top right quadrant of the image, while the incoming dependencies are on the top-left and bottom-right quadrants. It is obvious that this class plays a center role in Cassandra and it is literally interacting with almost everything.
But acknowledging, that this would need some decoupling, how could you actually improve it? The easiest solution is to to introduce one or more interfaces for the StorageService class and then require every user of the class to use the interface instead of the class itself. The interface will have no dependency to the StorageService class – it is the other way around – Storage service implements the interface. That inversion of dependencies is called the dependency inversion principle and was first described by Robert C. Martin in a 1995 paper.
But now let’s get back to our original question – have things gotten better or worse over the last couple years? It looks like things got a lot worse – the 477 file cycle group of Cassandra 1.2.6 grew into an incredibly big cluster of 1,368 Java files. We also found a second cycle group of 131 Java files that was not there before, you could say our original tumor had metastasized.
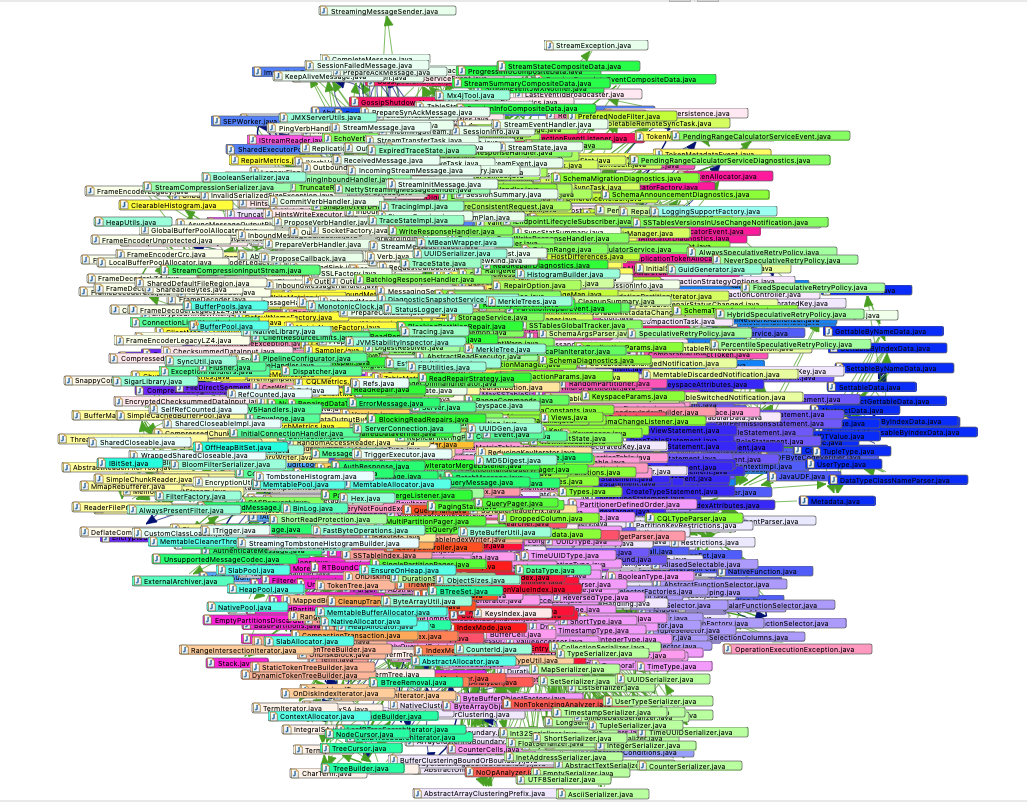
If you like big balls of mud, this is as good as it gets. The metrics mostly confirm the deterioration of architecture, the metric “Propagation Cost” now grows to 73%, ML (maintainability level) only marginally changed to 10%, an increase of 0.6% probably caused by a minor change of the package structure. Another metric confirming the trouble we are in is ACD (Average Component Dependency) with a new value of 1,380 (from 470 with 1.2.6), i.e. every Java file directly or indirectly depends on 1,380 Java files.
So now I grew even more curious and wanted to find out if there wasa version in between that actually had an improvements in metrics. The short and simple answer is no. I analyzed Cassandra 3 to compare it with Cassandra 4. Here is a summary of the metric changes between version 3 and 4:
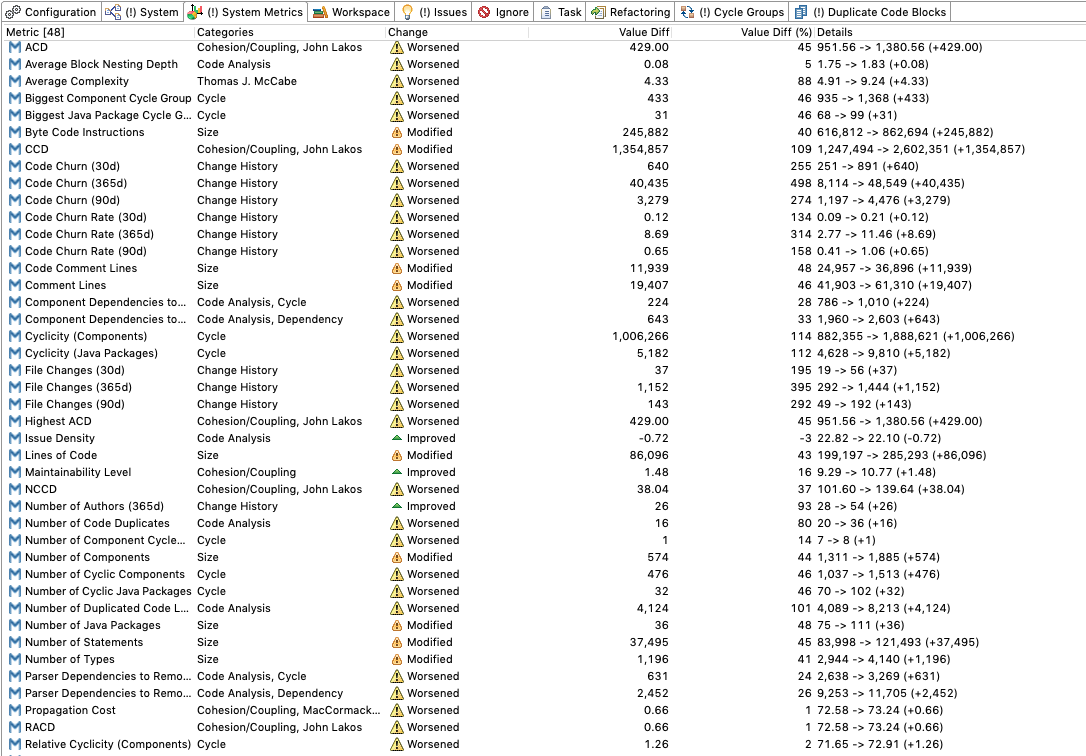
You can see that ACD increased from 951 to 1,380 (45%). Lines of code grew by 86,096 to ~285,000 (43%). Since coupling should grow much slower than your code, this is bad news and proves my point.
Now, is that situation similar for most projects? Again, that is probably a yes – confirmed by many software audits I did over the last 2 decades. But there are notable exceptions, for example the Spring Framework. Spring is one of the best engineered frameworks I have ever seen. There are almost no cyclic dependencies and there are clear architectural boundaries between the different elements of the framework. I assume that is caused by the attention to detail of the original developers like Jürgen Höller – he was very serious about not allowing unwanted dependencies in the code and achieved that with a mix of tools and meticulous code reviews.
At the end we have to look at the lessons learned from this analysis. A few simple programming rules could have completely avoided that outcome, like:
- Do not allow package cycles in the code
- For Java file cycles, it is best to avoid them too. If that is not possible limit the size of cycle groups to a maximum of 5 elements from the same package.
- Design an architectural model that breaks your build if somebody introduces unwanted dependencies. This can be done with free tools like ArchUnit or fancy commercial ones like Sonargraph.
- Compute and control metrics in your CI build, make the build fail if certain thresholds are violated.
You can assume that in the end – even if you spend money on a tool to keep your code clean from the beginning – this investment will pay for itself in less than a year. As always, please feel free to add a comment below. If you are interested in more content like that please follow me on Twitter (@AZ_hello2morrow).
Great article. Do you provide code to analyze other projects? I could imagine to use this measures in teaching. I hope its not exclusively built for Java.
You just need Sonargraph-Architect, and it works for Java, C#, Python 3 and C/C++. If you use it for teaching you might be eligible for a free license.