Sonargraph 12 is out! This release contains a couple of major changes: A reworked Exploration view, a refactored System view (dashboard) with new metrics and visualizations, faster C/C++ parsing and various other improvements.
Reworked Exploration View
Let’s start with the reworked Exploration view, which is one of the most frequently used features in Sonargraph. The Exploration view is very handy to visualize dependencies between elements, which are unfortunately often very much entangled and perform a great display for the “Big Ball of Mud” syndrome.
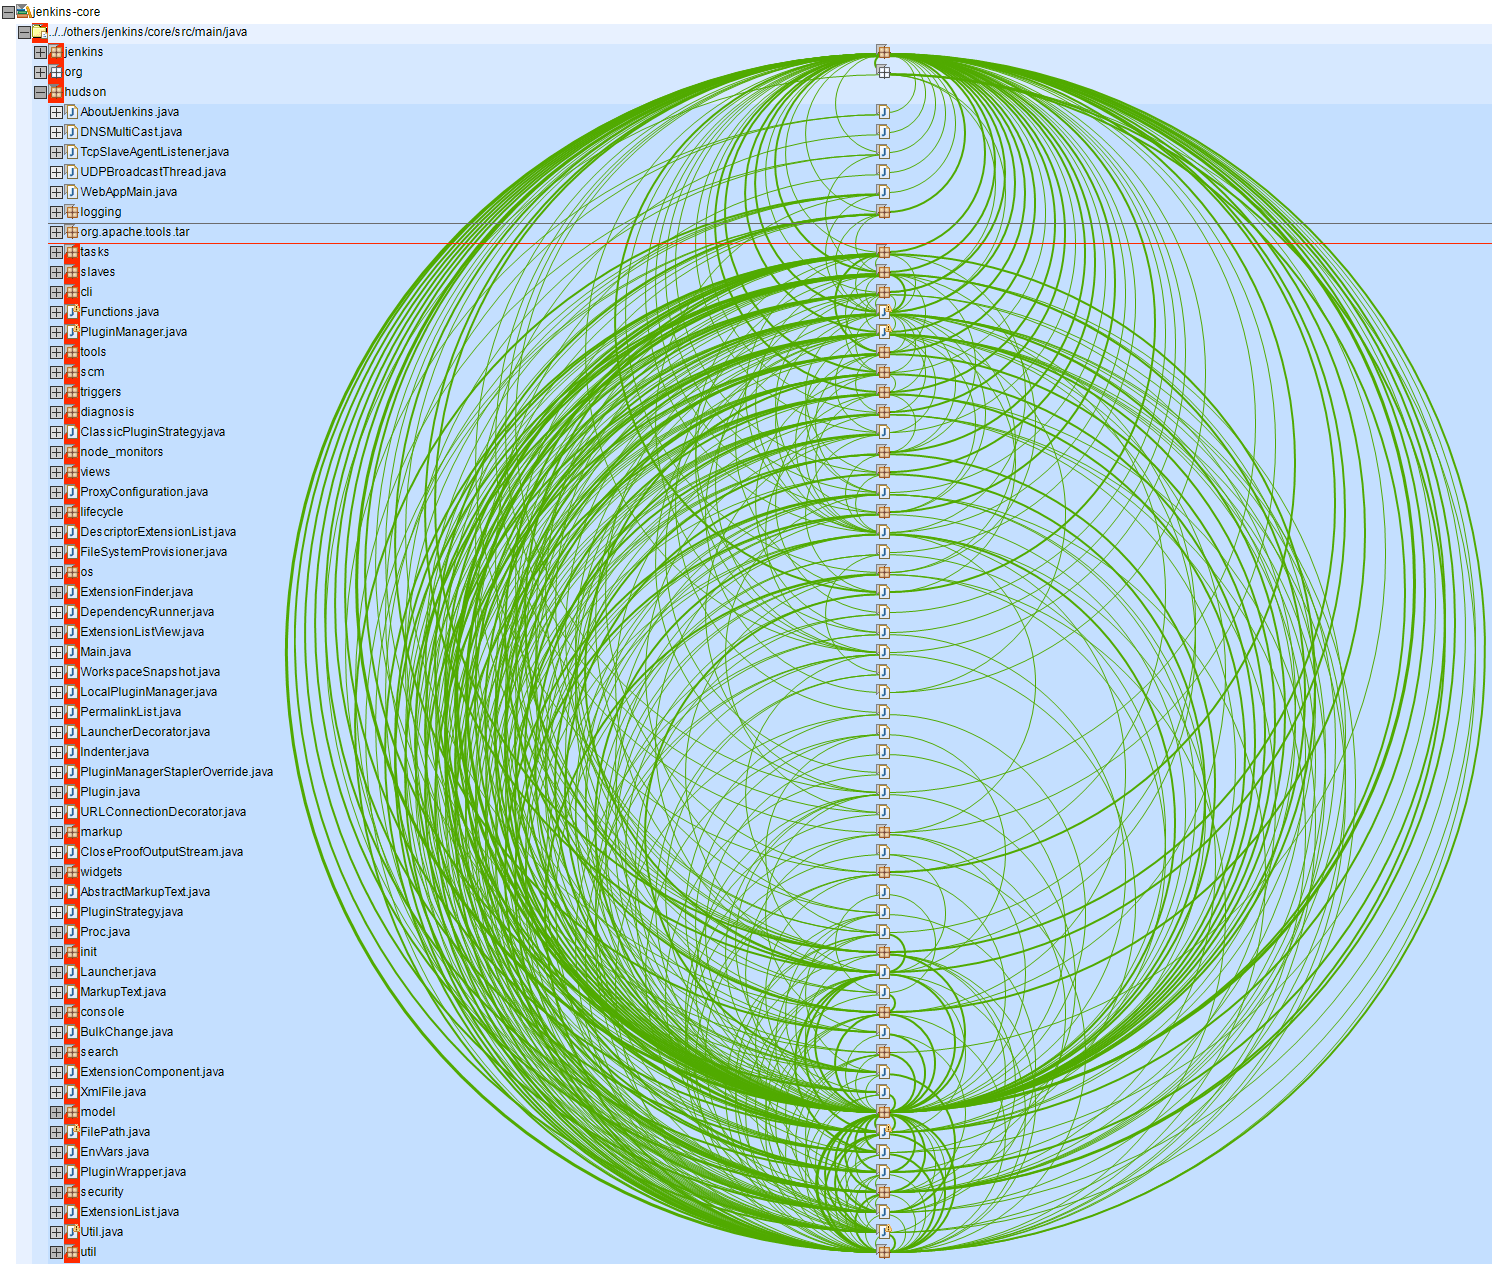
The new Exploration view performs ad-hoc level and cycle analysis for nodes underneath the same parent, shows cyclic nodes with a red background and visualizes the levels by showing horizontal grey lines. Now it is more transparent, how children of a node depend on each other. This makes refactorings easier, like splitting a large package or class, because elements on the same level are independent of each other unless they are part of a cycle:
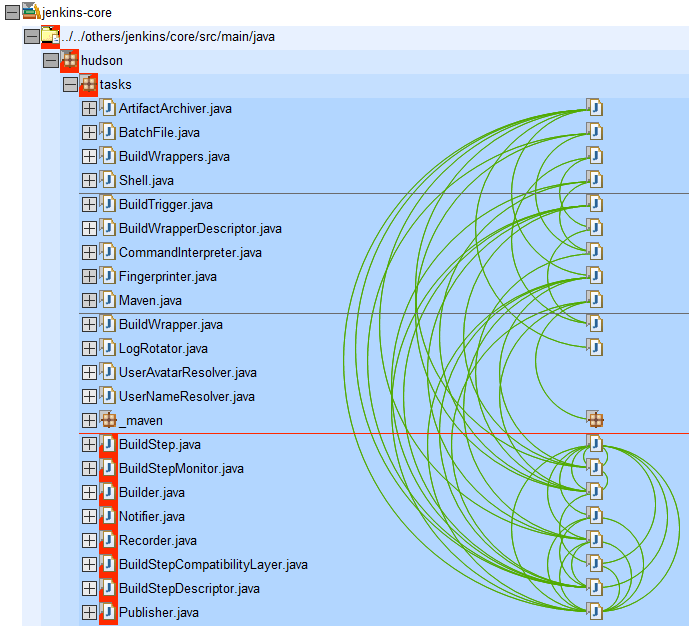
There is a lot of additional information shown via decorators, for example if any elements or dependencies are omitted by the chosen focus options. If elements participate in a cycle group this is indicated via a red background color. It is also possible now to easily extend the scope of an already opened Exploration view: Simply open the search dialog via the “Find Elements…” context menu and add any other element of the software system.
Additional enhancements:
- Applying a focus does not change the order of nodes.
- Improved usage of vertical space by auto-squeezing the arcs.
- User-defined zoom level is applied all the time.
- Added creation entry ‘Select and Reveal’ allowing the user to open a complete Exploration view without applying a focus, selecting all input nodes and revealing the first input node.
- The applied presentation mode can be changed any time.
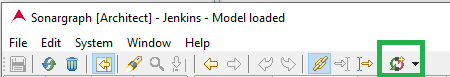
As part of our initiative to provide easy access to Sonargraph’s functionalities, there exists now a button on the toolbar that opens the Exploration view for the complete system.
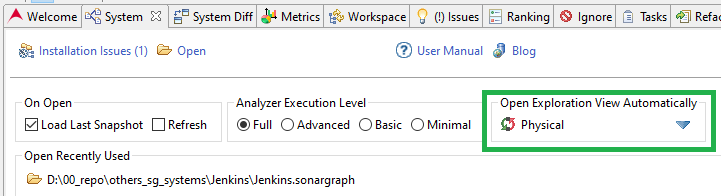
And there is also a configuration option to automatically open an Exploration view right after a system has been opened and refreshed.
Restructured System View (Dashboard) with new Metrics
The dashboard in previous versions showed a lot of information. After taking a step back and viewing it from 10.000ft we got the idea that the displayed information was too unstructured.
The information is now clustered in categories like “Architecture”, “Structure”, “Complexity”, etc., making it easy to spot problematic areas (if there are any) as shown in the following screenshot:
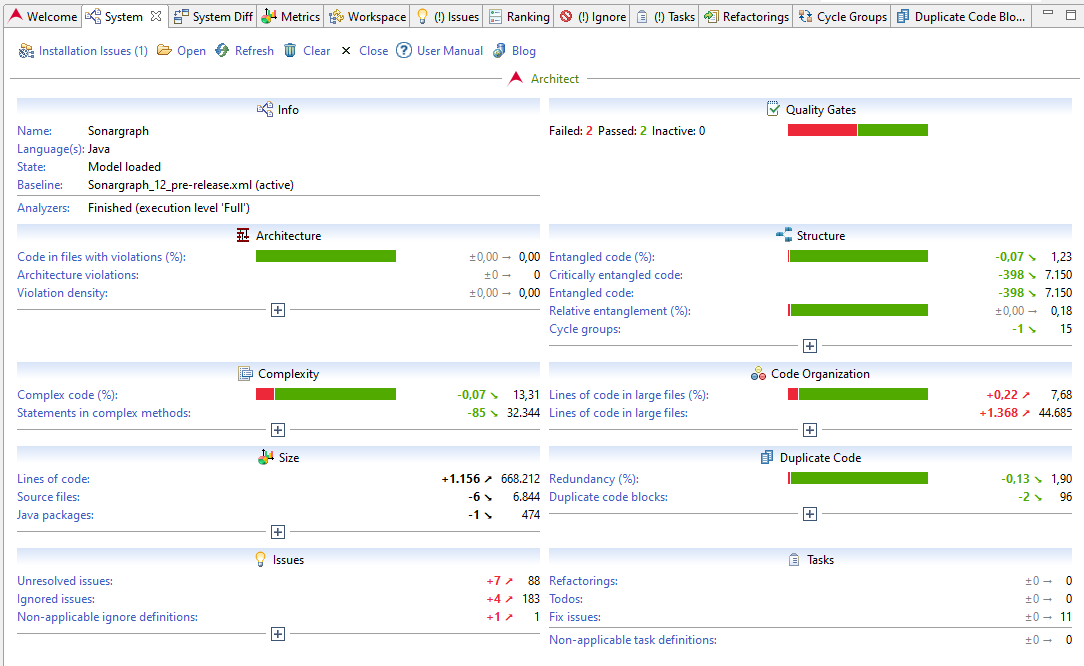
Previously, the reported issues were also too hard to interpret: Due to missing context information, it was not possible to judge the overall system state. For example the number of cycle groups alone does not reveal how much the system is suffering from this kind of issue. There might be only one big cycle group containing most of the system’s files or a tiny cycle group consisting only of two files.
Thus, we set this now in context of the whole system. For example the new metric “entangled code (%)” is computed as follows: Taking all files involved in any cycle, summing up their lines of code values and setting this into relation to the lines of code of the complete system. Thus, the value of “entangled code (%)” also represents the probability that if the developer is looking at any line of code, that its source file is involved in a cycle. This value is also visualized as a bar chart and thus the impact of cycles on the system is directly visible.
The same approach has been implemented for “Architecture”, “Complexity”, “Code Organization” and “Duplicate Code”. Each of these areas contain metrics that represent how likely a developer is affected by the problem when randomly opening a file or looking at a line of code.
A lot of boxes are expandable and provide easy access to more details.
Changed Base For Metric Computation
Another good reason to make this a new major release was the decision to change how some metrics are calculated. Now, the code discrimination is taken into account and also the effect of resolutions on metric values has been removed. Each of these changes is described next.
Code Discrimination
Sonargraph offers to discriminate code via workspace filters. Relevant for metrics and issues are “Production Code” and “Issue” filters. The “Production code” filter allows the separation of test code from code that is deployed to production. Code excluded by this filter is not contributing to any metrics. There are also no issues generated for this code, with one exception: If there is a reference from excluded code to your production code, this is flagged as “Dependency to Excluded Internal Component”. A detailed description about the filters is provided in our user manual.
The “Issue” filter allows to identify generated and legacy code, which you don’t want to touch. Code excluded via the “Issue” filter is contributing to metrics but does not produce issues, except architecture violations.
The “Size” box in the System view now displays the code discrimination, e.g. how many files are contained in “test” (i.e. excluded via “Production code” filter), “issue-ignoring” (i.e. excluded via “Issues” filter) and “fully-analyzed” code.
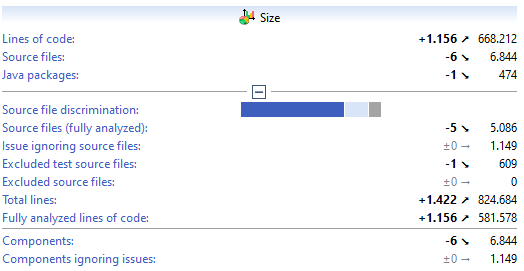
The new metrics mentioned in the previous section focus on the “fully analyzed” code, since that is where developers spent their time. Also, the computation of some other “overview” metrics like Average Component Dependency (ACD), Normalized Cumulative Component Dependency (NCCD), Average Complexity, Maintainability Level, etc. are now only computed for the “fully analyzed” code and no longer including “issue-ignoring” code. The reasoning is the same: Metrics and their trends should tell you something about the code that the developers are directly working with. They should not change for example when the code generator spits out additional error handling code.
Effect of Resolutions
In previous versions metrics like “Number of component cycles” or “Number of cyclic components” changed if a component cycle group was resolved with an “Ignore” or “Fix” resolution.
This made it too difficult to spot what caused a metric to change. And the state of the code base is still the same, whether or not the resolution exists. If a developer needs to understand the code, she is affected by the cyclic dependencies, overly large files, duplicate code, etc. as long as the issues have not been fixed.
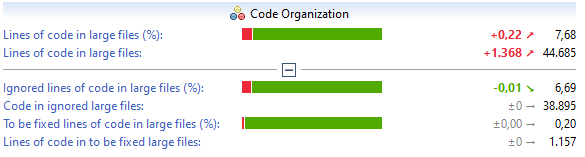
Thus, a couple of additional metrics have been introduced to make it transparent how much of the code base is affected by “fix” and “ignore” resolutions, shown for example in the System view as “Ignored lines of code in large files (%)” and “To be fixed lines of code in large files (%)”:
If you are using a baseline created by previous Sonargraph versions, take this difference into account when interpreting metric value changes. Ideally, you check out the system for the time that the baseline was created and re-create the baseline with Sonargraph 12.
Faster C/C++ Analysis
Parsing of C/C++ code takes a lot of time due to the huge size of files after all include dependencies have been resolved. Sonargraph uses an external C/C++ parser which unfortunately cannot be run in parallel within the same virtual machine.
But with Sonargraph 12 we refactored the connection to the parser which is now executed by multiple daemon processes. With this approach the parsing speed is increased at least by a factor of 4. On a really powerful machine with a lot of processors, the default number of 8 daemons can be increased via an environment variable to further reduce the parsing time.
Futher Improvements
Welcome Page
As described previously, we worked on making Sonargraph easier to use. As part of these efforts, we implemented a “Welcome” page that help new users to get started.
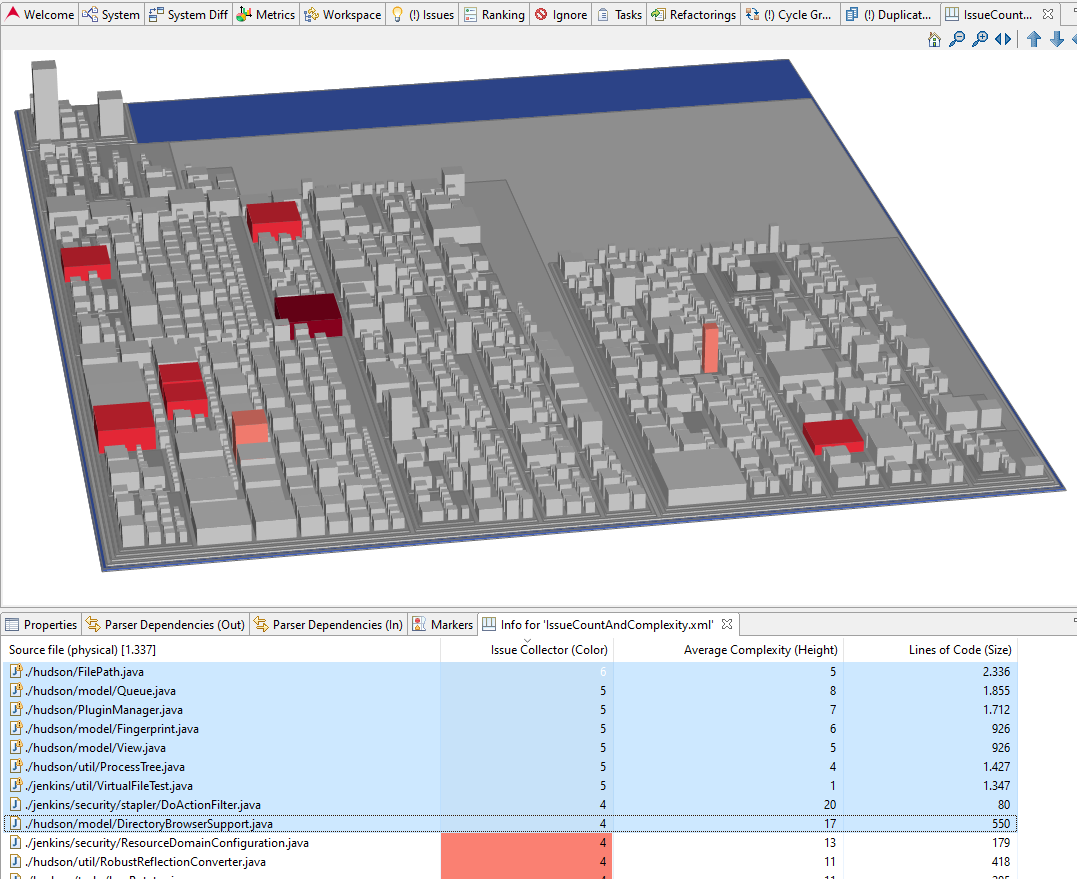
Treemap Info View
Additionally, the new Treemap Info view displays the data represented by the treemap in a table. This allows all the standard interactions like sorting and filtering and eliminates waiting for tooltips to appear in the Treemap.
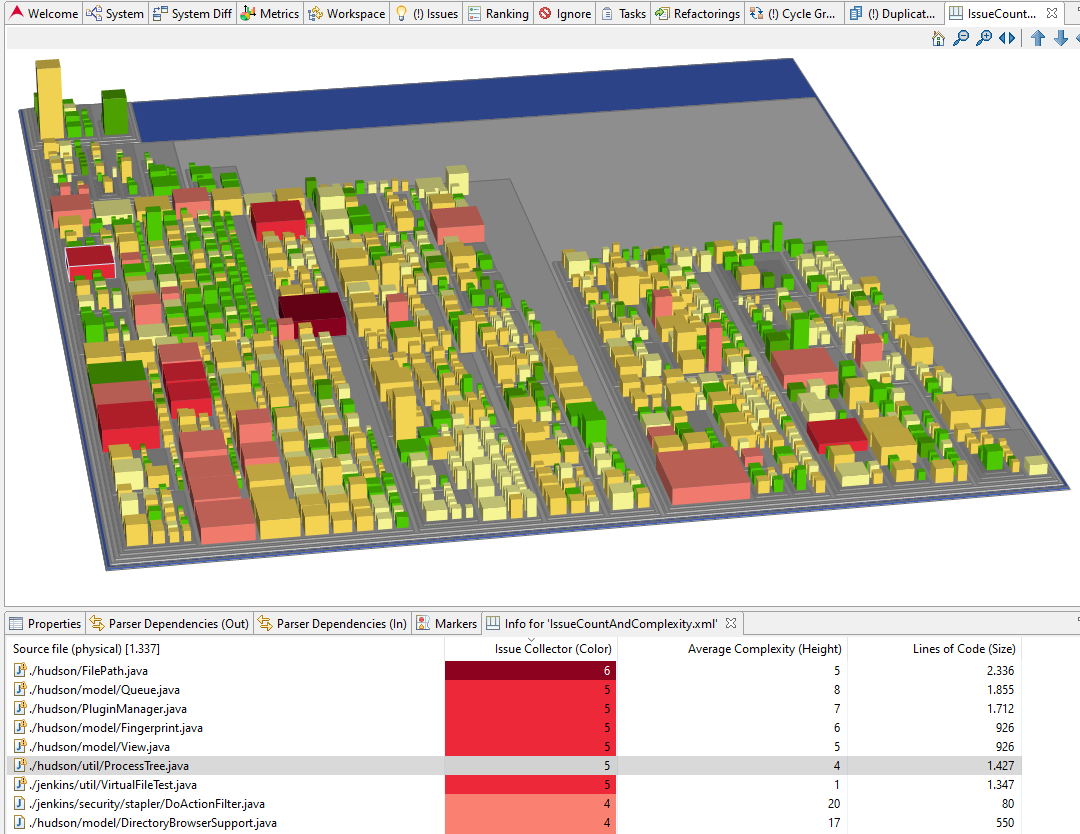
Elements selected in the info view are highlighted in the treemap, which makes it very easy to locate elements within the map.
Sonargraph Gradle Plugin
Sonargraph 12 brings along an improved Sonargraph Gradle plugin. Now not only recent Gradle versions >=7.0 are supported, but also all Gradle projects that produce classfiles into Gradle ‘source sets’. In the past Sonargraph Gradle plugin did presuppose Gradle projects using Gradle’s Java plugin.
We hope that the new features make Sonargraph easier and more fun to use. Let us know what you think!