Sonargraph often discovers a huge number of issues for large software projects. This is especially the case for projects that do not use static code analysis tools and that have many contributors. The analysis results can be overwhelming because it is not obvious where to start with quality improvements.
A common best practice to improve code quality is “to keep a lid on it” by preventing further issues to be introduced in new code and gradually improving existing code where it needs to be changed. This is described by Robert Martin as the boyscout rule: “Always leave the campground cleaner than you found it.” [KH]
This blog post explains how Sonargraph’s “System Diff” feature helps to focus on recently introduced issues that need the developer’s attention.
Situation
To make the blog post more interesting, I would like to analyse a well-known real-world software project with a long history, because I think that is better than a little artificial sample project with some made-up problems. The project of my choice is Hibernate-ORM (https://github.com/hibernate/hibernate-orm, cloned on 2020-04-23) and I focus on its module Hibernate-Core. It serves as a good example, how a widely-used project shows signs of structural quality problems. I do not mean to put a bad light on the project, but this kind of structural decay happens inevitably if you do not spend energy into fighting the erosion. We see this all the time. Of course, code structure issues are only one aspect of quality. Whilst it has a big impact on the maintainability, it does not say anything about its correctness, performance, etc… (If any developer of an Open Source project is interested in using Sonargraph, let us know. We are happy to support you! Sonargraph is free for Open-Source non-commercial projects.)
Hibernate-Core is sufficiently big with ~ 487 000 LOC and Sonargraph finds a reasonable amount of issues, so let us start and see how the System Diff feature could have helped!
The blog post is structured as follows: I shortly explain the Sonargraph setup followed by a quick analysis of the code’s structure. Then the focus is on utilizing the “System Diff” to concentrate on the changes with respect to metrics and issues. In the end, I will outline, how we think that the “System Diff” is put to best use.
Setup of the Sonargraph System
I cloned the GitHub repo from https://github.com/hibernate/hibernate-orm and built the project. Then, I created a simple Sonargraph system by adding a manual module and providing the source and class root directories, see screenshot below (click to enlarge). All class files are compiled into the same target directory, and to avoid Sonargraph complaining about “No source file found”, the source directories of generated code are also included in the workspace definition. An “Issue filter” is defined, so that issues are only reported for manually written source code.
Since I want to compare several revisions of the project, the Sonargraph system definition is stored outside of the project. (The usual recommendation is to store the system definition together with the sources and manage it together in the same VCS.)
Then, with the help of a little script, tagged commits (i.e. releases) are checked out, the project is built using Gradle, and Sonargraph-Build is executed that produces snapshots and reports of the system as well as the System Diff HTML report to make it easier to spot an interesting change between releases. The analysis takes about 2-3 min for a single release, so less than an hour is needed for all 5.2 releases. The setup of Sonargraph-Build for this kind of batch processing is worth a separate blog post…
Working with snapshots has the benefit of being “detached” from the code base, saving you from the need to have the correct version checked out and built on your machine as Sonargraph requires the byte code for analysing Java.
Next step is to look at the dependency structure.
Quick Analysis of the Code’s Structure
When I ran the first analysis for Hibernate on the current code base, I thought there was a problem with Sonargraph, because the cycle analysers seem to be stuck. But that impression is caused by two gigantic cycle groups that need several seconds to be analyzed: A package cycle group consisting of 263 packages and a component cycle group consisting of more than 2137 components. We use the term “component” as defined by John Lakos: “A component is the smallest unit of physical design” [JL]. Thus, a component is equal to a source file in Java.
Why am I focussing on cycle groups? Because cyclic dependencies make a software harder to understand and are a good indicator for structural decay. More details can be found in a blog post about the impact of cycles on the dependency structure written by my colleague Dietmar Menges. Using the Exploration and Cycle views in Sonargraph, the package cycle group looks like this, where the green arcs denote dependencies in the code:
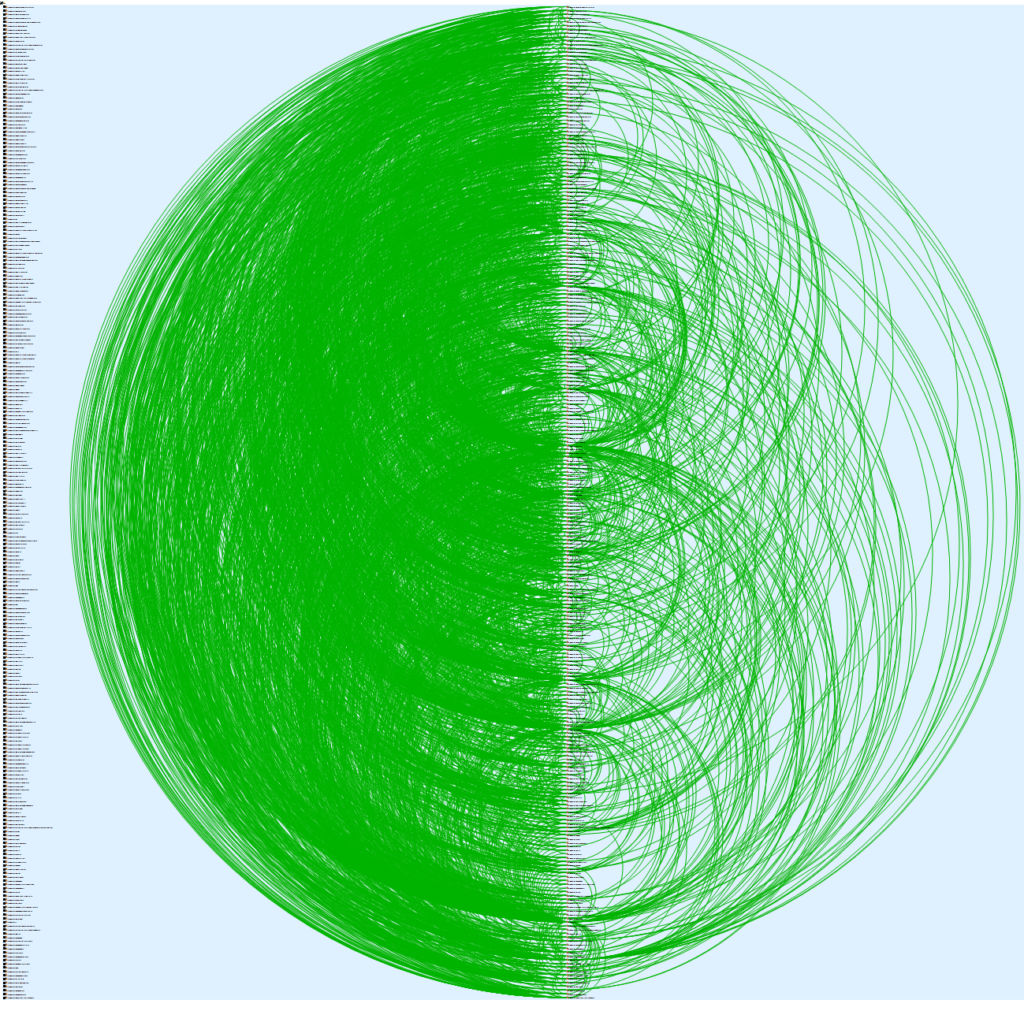
Package Cycle Group in Exploration View
The arcs in the Exploration view point counter clockwise and the layout algorithm minimizes upward dependencies, that’s why there is less density on the right. But ideally, there should be no green arcs on the right.
The Cycle Groups view draws all packages and the dependencies between them. Bi-directional dependencies between two packages are drawn in blue color:
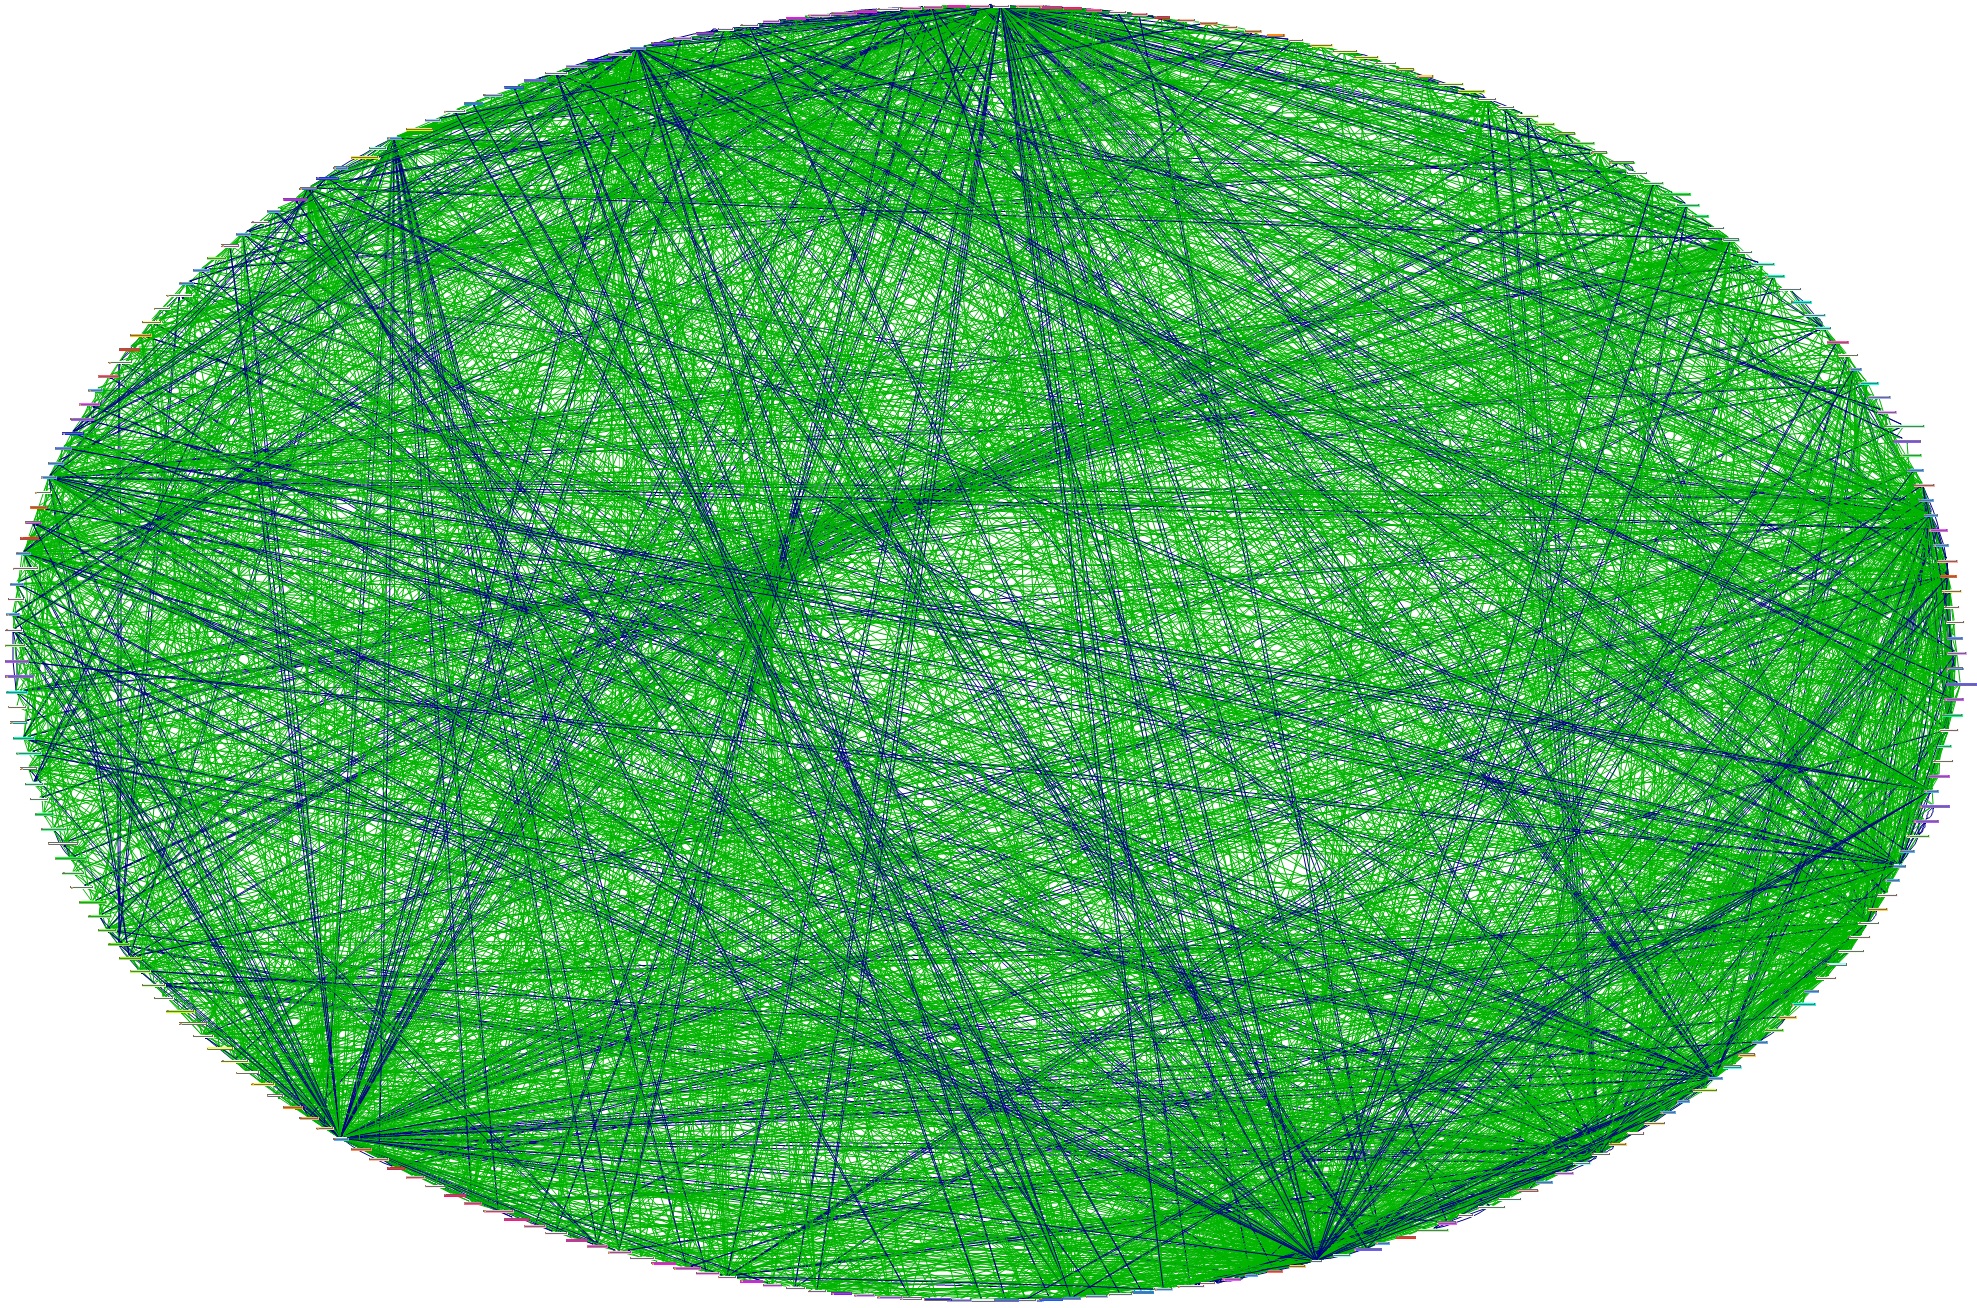
Package Cycle Group in Cycle Group View
The dependencies making up the package cycle group consisting of 263 packages (out of a total of 283!) are so packed that the graph is of little use, as it is extremely hard to trace individual connections. (It might be a nice structure for printing and sticking it to the wall.) Obviously, a component cycle group consisting of 2137 elements (out of a total of 3419) is even worse. This means that 93% of the packages and 63% of the components are involved in those two cycle groups.
This is a situation that you want to avoid. Well, at least if you agree with our reasoning and for example that of Robert C. Martin as described in “Agile Software Development. Principles, Patterns, and Practices”, see “Acyclic Dependencies Principle” in chapter 20 about “Principles of Package Design” [RM].
At best, you don’t have any cycles in your system or at least you keep them to a manageable size, for example less than 6 elements. Sonargraph lets you customize the cycle group size threshold and if a cycle group surpasses it, the severity changes from “warning” to “error”.
Now, let us examine, how the cycle groups evolved over time.
Change Analysis
As described earlier, Sonargraph-Build generated snapshots and reports that were also uploaded to our upcoming product Sonargraph-Enterprise (currently in beta).
Sonargraph Enterprise allows the visualization of metric values over time. Here, I configured the 4 metrics to be shown. It is clearly visible that both component and package cycle groups grew over time.
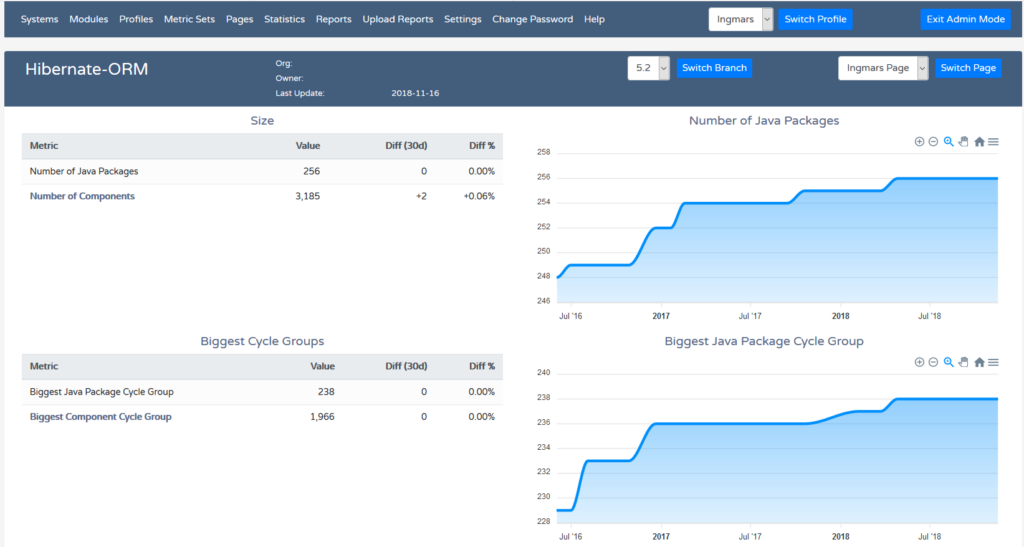
Metric Trends in Sonargraph-Enterprise
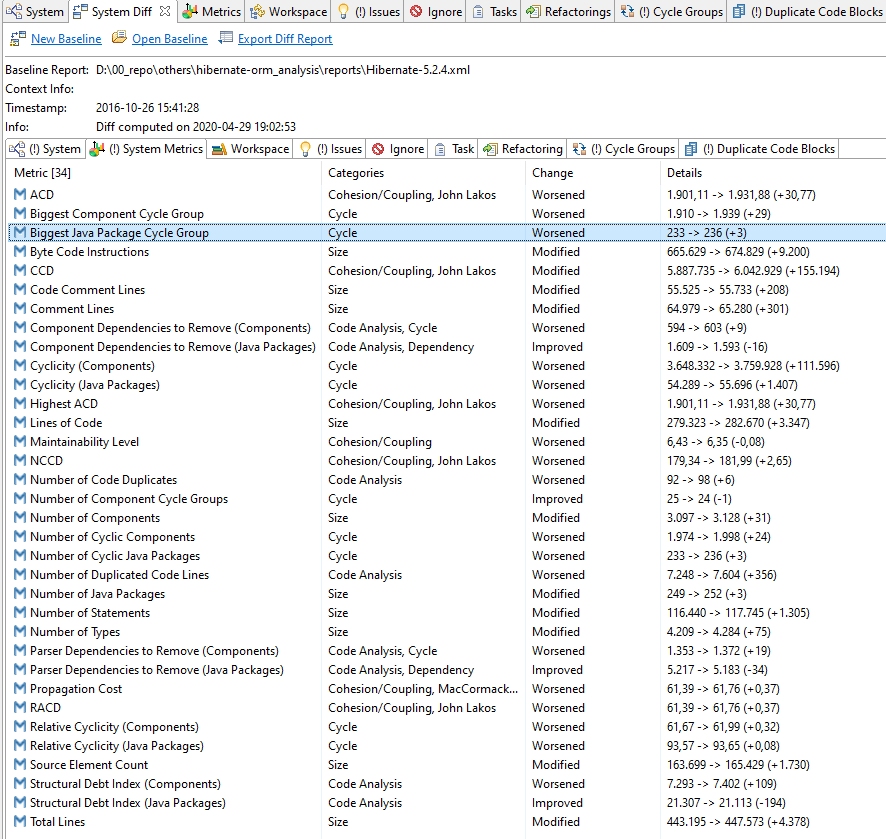
There is a noticeable increase in the largest package group size after October 2016 (version 5.2.4). To analyse this change in more detail, we open the snapshot of version 5.2.4 in Sonargraph and open the System Diff view. This view allows the generation of a baseline in the form of an XML report by clicking on the “New Baseline” link at the top. It does not matter if the system has been opened from a snapshot or parsed afresh. Then, I close the current system and open the snapshot for version 5.2.5. The System Diff automatically applies the last baseline and shows the differences to the current system state.
The “Metrics” tab shows that the project grew by 1% in terms of lines of code. The “Number Of Packages” increased by 3 and “Number of Components” increased by 31, both around 1% increase as well.
Let us see, what details the “Cycle Groups” tab reveals about the two cycle groups. Since we know that the cycle groups are huge, you should tick the checkbox at the bottom to hide unmodified cyclic elements. Expanding both nodes, you see which files and packages have been added to the groups.
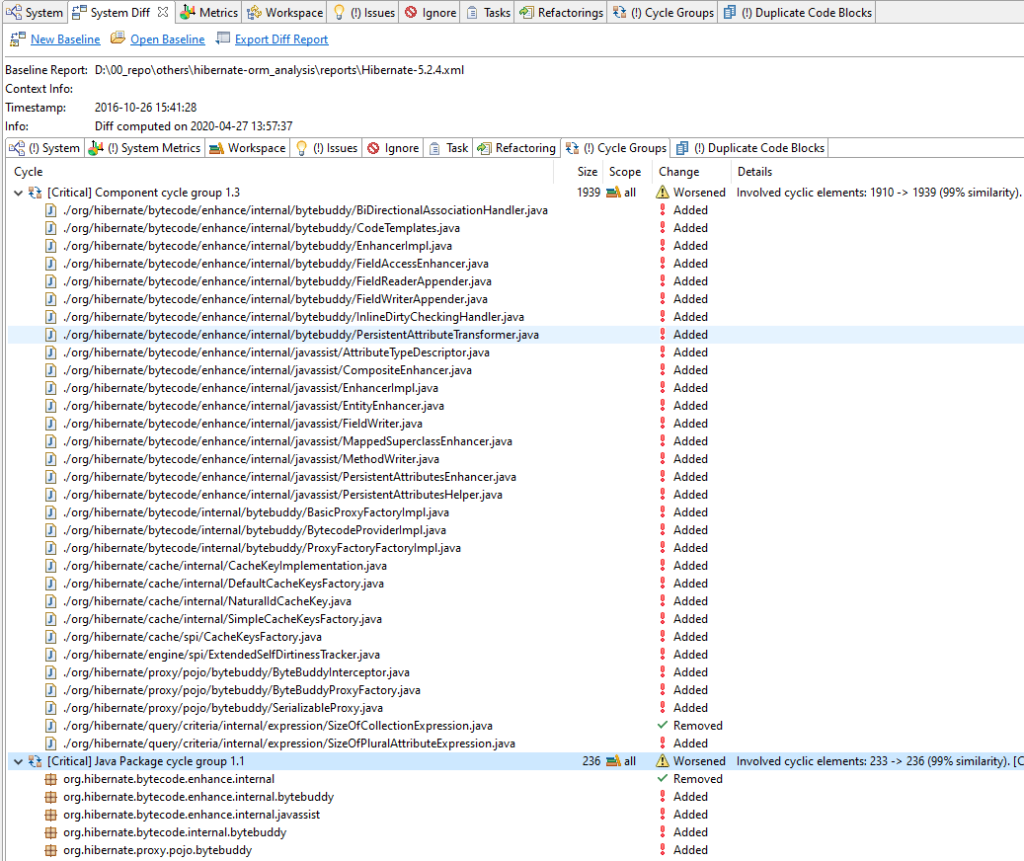
System Diff View (Cycle Groups)
The package cycle group increased by three elements and the component cycle group by 29 elements. This is a far better starting point for a refactoring than being confrontet with several hundred elements.
As the long-term trend has shown, the cycle groups grew over time for the 5.2 releases. Now, more than three years later, the cycle groups got even bigger and now contain 263 packages (+27) and 2137 (+198) elements. So, what is our recommendation to prevent this structural decay from happening?
How and When to Use the System Diff
As described previously, the System Diff feature allows quick and easy comparison of two Sonargraph analysis results. We propose to use this functionality whenever this kind of comparison makes sense. For example:
- Create a baseline at the beginning of a feature implementation and check for added and worsened issues during the code review before the feature branch gets merged.
- Create a baseline at the beginning of a Sprint and compare it with the current state during the Sprint retrospective.
- Create a baseline when a release has been finished and use it during the development of the next release.
The System Diff view not only shows new or worsened issues, but also differences in system metric values, resolved and improved issues. Thus, it also makes code improvements transparent.
Conclusion
Static code analysis tools like Sonargraph can produce an overwhelming amount of issues for software projects. The “System Diff” feature provides a focus on the changes in metrics and issues. This has been demonstrated by analyzing the differences of two large cycle groups between version 5.2.4 and 5.2.5 of the Hibernate-Core sub-module. Used during code reviews and Sprint retrospectives, the “System Diff” gives quick and easy feedback about good and bad trends and can be an excellent tool to fight quality decay.
Let us know what you think and apply for an evaluation license to give it a spin on your project!
References
[KH] “97 Things Every Programmer Should Know” by Kevlin Henney, O’Reilly, 2010
[JL] “Large Scale C++ System Design” by John Lakos, Addison-Wesley, 1996
[RM] “Agile Software Development. Principles, Patterns, and Practices” by Robert C. Martin, Prentice Hall, 2003

