Sonargraph is our tool to quickly assess the quality of a project. I get frequently asked, how Sonargraph supports the Enterprise Architect who needs to answer quality-related questions in the broader context across several projects.
Since we recently released new functionality that allows the automation of re-occurring quality checks, it is now the right time to write a blog post.
Example questions that an enterprise architect wants to answer:
- How frequently does a certain anti-pattern occur?
- How strong is the dependency on deprecated functionality?
- How many of my projects suffer from high coupling?
This article will demonstrate the following core functionality of Sonargraph to answer the above questions for a couple of projects and how to automate this analysis.
- Use a script to detect an anti-pattern (“Supertype uses Subtype”)
- Create a simple reference architecture to detect usage of sun.misc.Unsafe
- Add a threshold for a coupling metric (NCCD)
- Export a quality model
- Use Sonargraph Build Maven integration to execute the analysis.
- Create a small Java project to execute the Sonargraph Maven goal, access the data in the generated XML reports and create a summary.
Preparation
For the little “experiment” of this blog post, I used the following well-known projects:
- Netty (https://github.com/netty/netty), an “asynchronous event-driven network application framework”.
- Hazelcast (https://github.com/hazelcast/hazelcast), a “clustering and highly scalable data distribution platform”.
If you want to follow along, you need to do the following:
- Clone the above projects
- Since we only need the source and bytecode of the projects, it is enough to build them with “mvn compile” to save some time. In case netty’s compilation fails because of a style-check error, try “mvn compile -Dcheckstyle.skip”
- Register on our website (https://www.hello2morrow.com)
- Download Sonargraph Architect
- Request an evaluation key for Sonargraph Architect
- Add the following repository to your Maven configuration (M2_HOME/conf/settings.xml). If you are not familiar with this kind of configuration, the Maven documentation provides more information.
<pluginRepositories>
    <pluginRepository>
      <id>hello2morrow.maven.repository</id>
      <url>http://maven.hello2morrow.com/repository</url>
    </pluginRepository>
</pluginRepositories>
Step 1: Create the Software System
With Sonargraph 8.9 we released a new Maven goal “dynamic-report” that creates a new Sonargraph software system for a given project.
We will use this goal to limit the amount of work to setup the analysis.
You can display the help for the Maven goal by executing
mvn com.hello2morrow:sonargraph-maven-plugin:8.9.1:help -Ddetail=true -Dgoal=dynamic-report
The online user manual contains more details about the usage of SonargraphBuild.
We will create a Sonargraph system for Netty and use it to export a quality model that is then applied as a “reference quality model” for the cross-project analysis.
To create a new system, you need to specify the activation code. You can retrieve the activation code by logging into your account on our web site and go to “Account” -> “Your Licenses”.
Run the following command in the project’s root directory (replace _your_activation_code_):
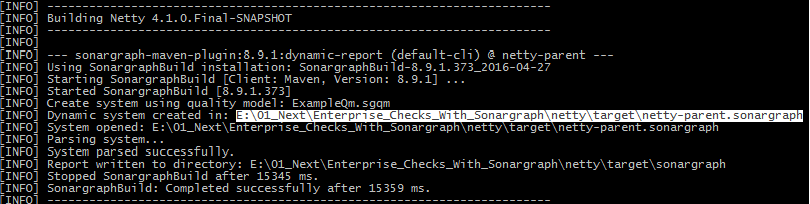
mvn com.hello2morrow:sonargraph-maven-plugin:8.9.1:dynamic-report -Dsonargraph.activationCode=_your_activation_code_ -Dsonargraph.reportFormat=XML
The path of the dynamically generated system is written to the console.
Step 2: Detect Anti-Pattern “Supertype uses Subtype”
Execute the following steps to detect the occurences of the anti-pattern:
- Start the Sonargraph application and enter the activation code.
- You can now open the system that has been created for Netty.
- The anti-pattern is already defined by a Groovy script and can be imported via “File” -> “Import Quality Model…”.
Only select the script “./Core/SuperTypeUsesSubType.scr”. - If you want to inspect the script or run it manually, select the “Files” view and double-click on Scripts -> Core -> SuperTypeUsesSubType.scr.
- To automate the script’s execution, open “System” -> “Configure” -> “Script Runner” and add the script.
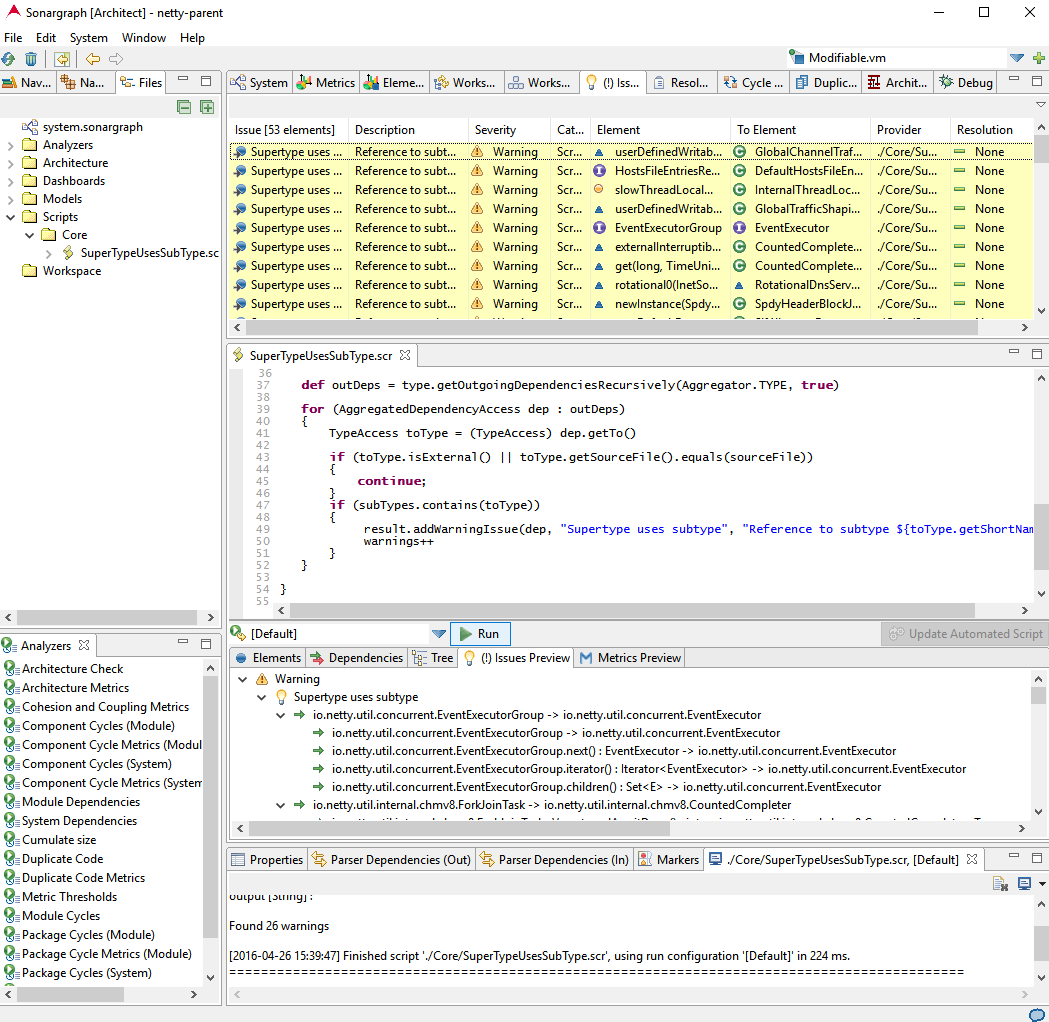
There should now be 53 issues created by the script in the “Issues” view (your results may vary slightly, since the project’s sources change). Play around with the filter option (top-right corner of the view) to focus only on those issues.
The following screenshot shows the filtered “Issues” view as well as the “Script” view with the result of the manual script execution displayed in the previews.
Step 3: Detect Usage of “sun.misc.Unsafe”
With Java 9 some types and packages will likely be removed from the JDK or at least need special treatment.
One of the types appearing frequently in discussions is “sun.misc.Unsafe”.
We will define a little architecture that detects the usage of this type in our projects:
- Select the “Files” view and right-click on the “Architecture” node.
- Create a new architecture file.
- Enter the following content that separates “internal” from “external” and hides “sun.misc.Unsafe” so that all references to it from internal code are marked as violations:
//"public" means, elements of this artifact can be accessed implicitly by "Internal" public artifact External { include "External [Java]/**" //"hidden" means that elements of this artifact //don't contribute to the default interface of "External" //therefore all references will be violations. hidden artifact Unsafe { include "**/sun/misc/Unsafe" } } artifact Internal { include "**" } - Right-click on the architecture file and select “Add To Architecture Check”. Several issues should now appear in the “Issues” view.
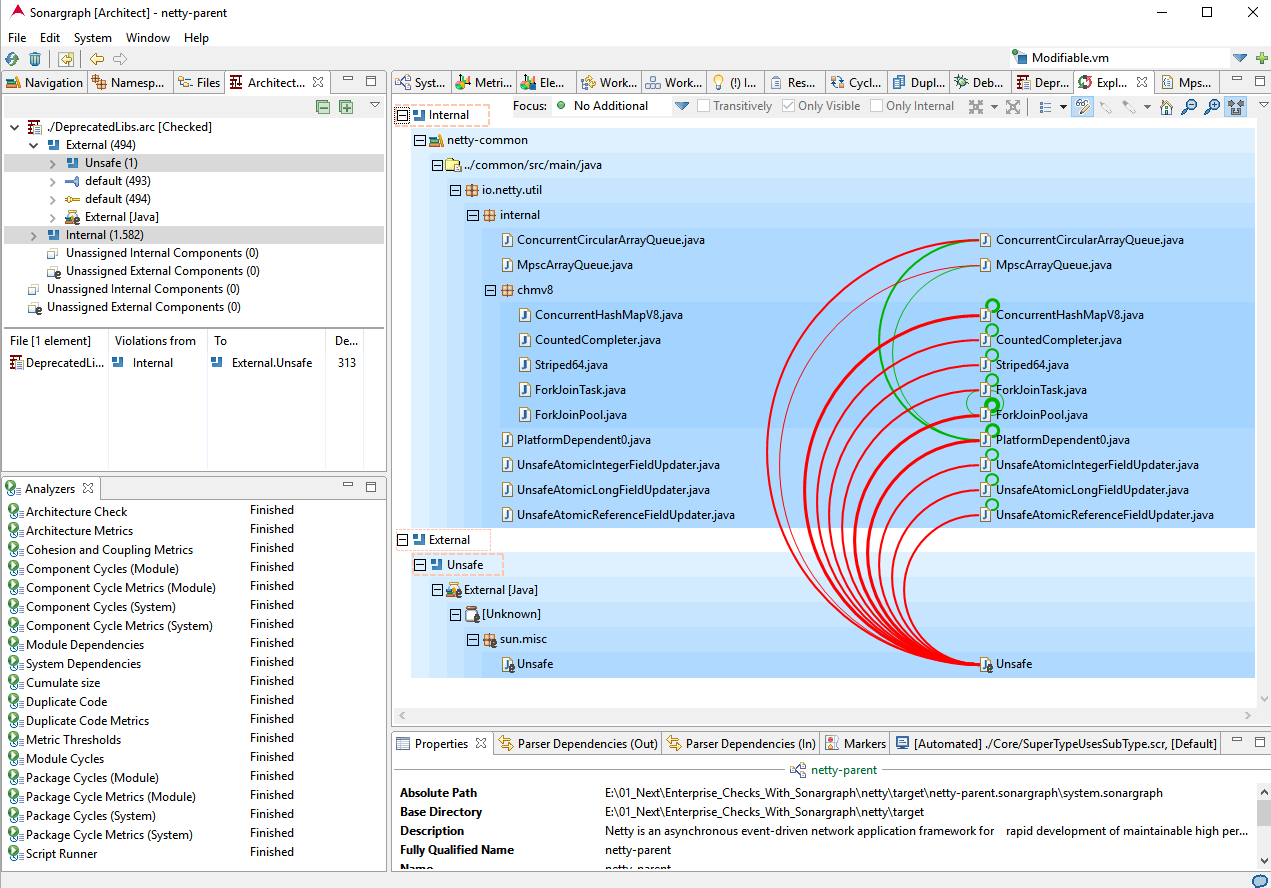
- To explore the violations, right-click on the file and select “Show in Architecture View”. By selecting the artifact “Internal” in the opened view, you see in the lower section that there are in total 313 violating references.
- For more detailed exploration, select the two artifacts “Unsafe” and “Internal”, right-click and select “Show In Exploration View” -> “No Additional”. Double-click on the red arc that represents the architecture violations.
The resulting view should look similar to what is shown in below screenshot.
More details about our Architecture DSL can be found in previous blog posts Architecture DSL and the online manual.
Step 4: Add Threshold For Coupling Metric
We want to ensure that the projects are easy to maintain, i.e. it should be easy to replace existing functionality, refactor certain parts, etc.
One way of controlling this requirement is to track the “coupling”. To be independent of the size of our projects, we choose the metric “Normalized Cumulative Component Dependency” (NCCD).
To set the threshold for this metric on Module level, we need to do the following:
- Open the “Metrics” view.
- Select “Module” in the combo-box (top-left).
- Scroll down to the metric “NCCD”.
- Right-click on the metric entry and select “New Threshold…”.
- Set the upper threshold to 15.
Investigate some other coupling metrics like “Average Component Dependency” (ACD). The project does not contain big cycle groups, therefore the coupling is rather low and metrics like “ACD” confirm that.
Top value on module level is 45.8 for module “netty-buffer” which means that on average every source file depends on 45 other files in this module.
Step 5: Export Quality Model
To make all these configurations re-usable as a “reference quality model”, it needs to be exported:
- Make sure all files are saved.
- Select “File” -> “Export Quality Model…”. Specify a name and directory.
Step 6: Use the Quality Model in Sonargraph Build
We will now configure SonargraphBuild to use the exported quality model.
Open a shell in the root directory of the Hazelcast project and run the following command:
mvn com.hello2morrow:sonargraph-maven-plugin:8.9.1:dynamic-report -Dsonargraph.activationCode=_your_activation_code_ -Dsonargraph.reportFormat=xml,html -Dsonargraph.qualityModelFile=_quality_model_path_
Obviously, you need to replace _your_activation_code_ and _quality_model_path_ with correct values.
The quality model path can be relative, e.g. “../ExampleQm.sgqm”.
Open the created system in the Sonargraph application.
You will see that there are 135 architecture violations, 159 anti-pattern occurrences and one module violating the NCCD metric threshold (again: your results may vary, since the project’s sources change).
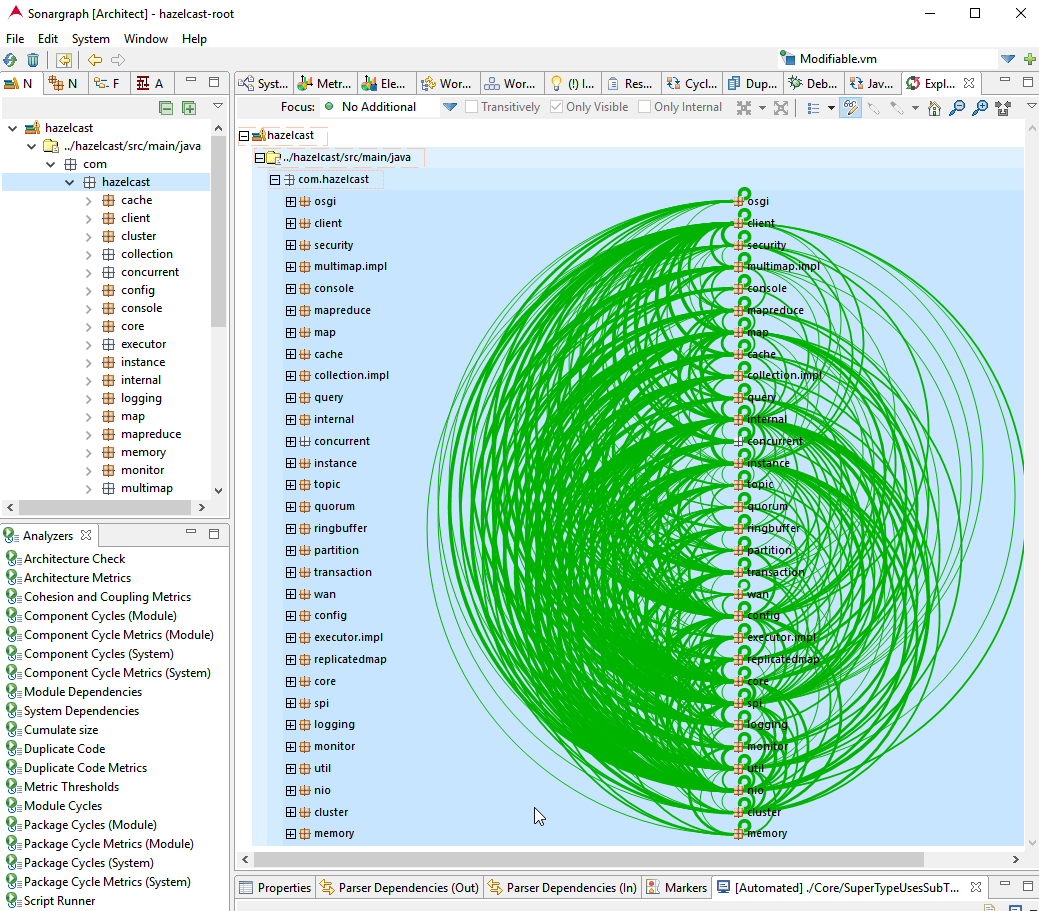
If you open the “Cycle Groups” view, you can see that the module “hazelcast” contains a biggest package cycle group with 212 involved packages and a biggest component cycle group with 1858 source files.
If cycle groups of these sizes exist, a NCCD value of 175 is no surprise. I leave the interpretation of this value with respect to maintainability to you…
The coupling can be visualized using the “Exploration” view with “No Additional” for the package “com.hazelcast” under the module “hazelcast” and then expand “com.hazelcast” node (arcs represent actual dependencies and need to be read counter-clockwise):
Step 7: Automate Quality Checks
Let’s say you are responsible for the overall quality of a number of projects and you want to track the evolution and reduction of the detected issues.
If you already use SonarQube, you can use our Sonargraph plugin to integrate the issues into the SonarQube metric database.
If you are using a custom quality-pipeline or just want more flexibility and set your own focus in the analysis, this final step demonstrates how you can easily access the results of the Sonargraph analysis for further processing.
Since we are also using the functionality to extract metrics from the generated XML report for our Jenkins and SonarQube integrations, we open-sourced the project Sonargraph Integration Access on GitHub.
The example project created for this blog post can be found within that project at /src/test/xproject-metric-aggregation/pom.xml.
The project contains 2 classes with together only 260 lines of code.
The main method of the Executor class executes the Maven command of step 6 for all projects specified as input parameters (here Netty and Hazelcast), opens the generated XML reports using sonargraph-integration-access, extracts only the relevant information and prints a summary with the aggregated result (you might get slightly different values, since the projects are actively maintained):
-------- Result for 'hazelcast' -------------
System metrics:
   Files With References To Unsafe: 4
   References To Unsafe: 135
   Occurrences of Supertype uses subtype: 159
   Modules violating NCCD threshold: 1
Module metrics:
    hazelcast:
        NCCD: 175.86
-----------------------------------------
-------- Result for 'netty' -------------
System metrics:
   Files With References To Unsafe: 11
   References To Unsafe: 313
   Occurrences of Supertype uses subtype: 53
   Modules violating NCCD threshold: 0
-----------------------------------------
-------- Cross-Project Result -----------
Occurrences of Supertype uses subtype: 212
Files With References To Unsafe: 15
References To Unsafe: 448
Modules violating NCCD threshold: 1
-----------------------------------------

Finished processing in 47043 ms.
Note:
If you want to “work” with the generated Sonargraph systems and add project specific details, select “Save As…” in the Sonargraph application and move the systems out of the “target” directory.
For existing system definitions, you can use the “create-report” Maven goal. The online manual contains more details.
The same functionality exists for the integration with Gradle.
Conclusion
This blog post has demonstrated how easy it is to set up quality checks, export them as a reference quality model and apply the checks for a number of projects.
With a little bit of Java code and the help of the “Sonargraph Integration Access” project, it is fairly straight-forward to automate the analysis and create higher-level metrics across projects.
The same approach can be used, if you want to integrate the results of the Sonargraph analysis into your custom quality-pipeline and persist the findings in a database for example.
This opens up Sonargraph for the implementation of your own automation ideas.
Let us know if you are missing functionality in the available APIs.
We love your feedback!