Designing a Metric to Detect Big Balls of Mud

Almost everyone who worked in software development for a while has come in contact with the dreaded big ball of mud (BBoM). If you are not familiar with the term, it describes software systems that have lost their architectural cohesion and suffer from extreme coupling and large cyclic dependency groups. That makes it much harder to do any changes on those systems, because everything is literally connected to everything else. Therefor it requires developers spending almost all their time trying to understand code before they can risk doing changes. And even then, the chance of regression bugs stay pretty high. If a system reaches this state, doing changes becomes so expensive, that rewriting the system from scratch might be cheaper than maintaining the old system. Unfortunately, very often it is not possible to rewrite the system, because the users can’t wait for years for a system replacement. This puts many development organization in a very uncomfortable place.

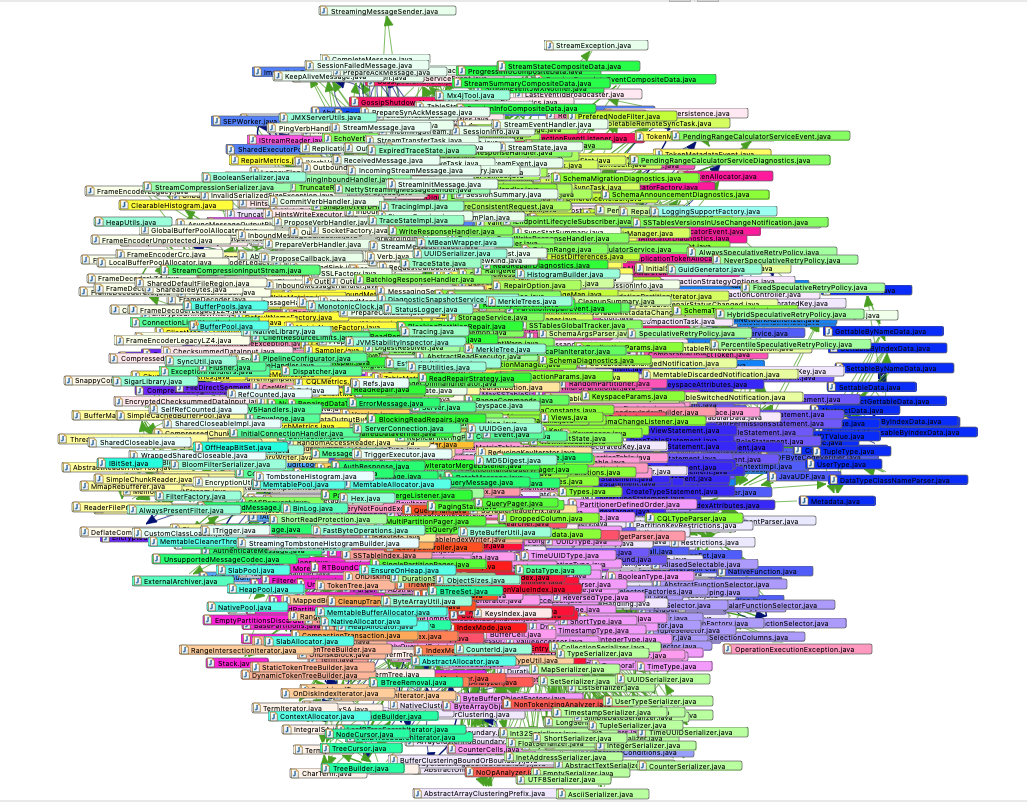
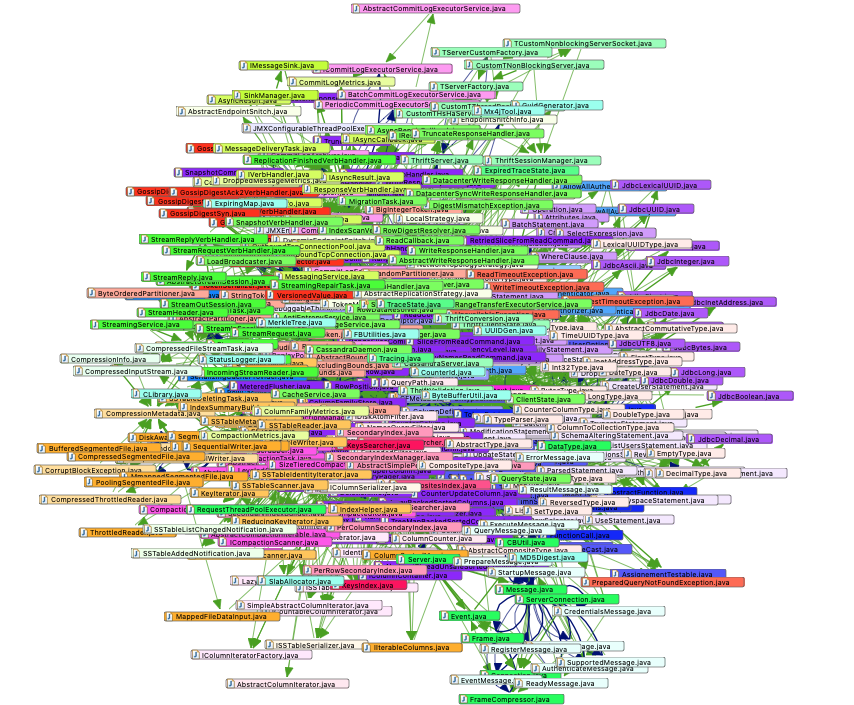
A big ball of mud visualized by Sonargraph

Read More

Changes to the Sonargraph Dashboard

The Sonargraph dashboard was designed to give the user a quick overview about several important aspects of software quality. The most important aspects in our opinion are “Architecture” and “Structure”, which are displayed at the top of the dashboard. After some internal discussions we decided that we could improve the metrics in the “Structure” box. Those changes will be rolled out with Sonargraph version 15.2.0, which is expected to be released this week.

Read More

Using Sonargraph-Enterprise to Track Key Quality Metrics

Sonargraph-Enterprise is designed to allow stake-holders to track important software quality metrics over time. The idea is that this would enable the early detection of harmful trends so that issues can be fixed while they are still easy to fix. The metrics displayed by Sonargraph-Enterprise can be fully customized by the user. However, in this article I will explain the “default” profile that comes with a set of preselected metrics that cover important aspects of code health and quality.

Read More

Setting up Sonargraph on your Project

Over the years we implemented many different methods to set up Sonargraph for your project. Some of them are now quite outdated and are only kept in the tool for compatibility reasons. This article is meant to help you with your initial setup and chose the most effective method for your particular circumstances. There is one section for each language supported by Sonargraph.

General Recommendations

Sonargraph maintains a folder for each software system, that contains a description of your project, the locations of source folders (and class folders for Java), your architecture model and all other parts of a Sonargraph quality model. We call this folder the Sonargraph system folder. It only contains text files (mostly XML) and should ideally be placed in the root directory of your VCS (version control system) repository. You also should add this folder to your VCS, since the Sonargraph model will evolve together with your software system. This will allow you to share one Sonargraph model with all the developers working on your project.

Each Sonargraph software system contains at least one module. Modules usually correspond to the modules or sub-projects in your IDE.

How to initially create this folder for your project is the subject of this article. The folder should have the name of your software system and always ends with ‘.sonargraph’.

Read More

Using ccspy for C/C++ Project Setup

Analyzing C/C++ projects with Sonargraph is always a bit more difficult due to the huge variety of different compilers and environments. We recently added a new import wizard that should simplify the process.

For a successful analysis of a C/C++ projects Sonargraph must be able to emulate the compiler you are using and also needs to know which source files are part of the project and the compiler options used for each source file, mostly the -I options for include directories and the -D options which influence conditional compilation.

The first part is solved by a so called “compiler definition”. Sonargraph comes with predefined compiler definitions depending on your platform. If your compiler is not among them you can always create a new compiler definition (menu File / New / Configuration). You can also manage your compiler definitions in the Sonargraph preferences. The main job of a compiler definition is to define the location of implicit include directories (for standard headers like stdio.h) and to define all predefined macros of your compiler platform.

Read More

Analyzing Software with Advanced Visualizations

I thought I’d use our new 3D city view visualizations to have a closer look at Apache-Cassandra, a very popular and successful open source project that implements a NoSql database. I know from previous analysis runs of the same software that it already had problems with structural erosion. Years ago I analyzed Cassandra 1.2.6 and found pretty big cycle groups for Java files as well as for packages. Maintainability Level was only 9.4% (everything under 50% is concerning) while the metric “Propagation Cost” has a value of 62%. That means that every change will affect 62% of all code directly or indirectly which also is not a good thing because it significantly increases the chance of regression bugs.

477 Java files form a beautiful big ball of mud in Cassandra 1.2.6

Before you say “this image is useless, you cannot see anything there” let me tell you that I agree. The point is to make sure that your software never ends up in that situation. This big cyclic conglomeration is making it close to impossible to modularize Cassandra or to put any kind of architectural model on top of it.

Read More

A Promising New Metric To Track Maintainability

A good metric to measure software maintainability is the holy grail of software metrics. What we would like to achieve with such a metric is that its values more or less conform with the developers own judgement of the maintainability of their software system. If that would succeed we could track that metric in our nightly builds and use it like the canary in the coal mine. If values deteriorate it is time for a refactoring. We could also use it to compare the health of all the software systems within an organization. And it could help to make decisions about whether it is cheaper to rewrite a piece of software from scratch instead of trying to refactor it.

Read More

Finding Distributed Packages/Namespaces with the Sonargraph Scripting Engine

Today I will show how to make use of a very powerful, yet underutilized capability of Sonargraph-Architect. By writing simple Groovy scripts you are able to create your own code checkers or define your own metrics. Many of our most useful scripts are just about 50 lines of code and therefore not a big effort to create. As an example we will develop a script that finds packages (Java) or name spaces (C#, C++) that occur in more than one module.

The scripting engine of Sonargraph is based on our scripting API. Most scripts are based on the visitor pattern. Using this pattern a script can traverse specific elements of Sonargraph’s software system model, which is basically a very big tree data structure. At the root there is the software system node, which is accessible by a globally available instance of class CoreAccess, called “coreAccess”. This specific instance is language agnostic, i.e. it can be used for scripts that support all programming languages supported by Sonargraph. When creating a script you decide wether it will be language specific or language agnostic. Language specific scripts have access to more detailed language specific data and will use different root objects like “javaAccess” or “csharpAccess”.
Read More