Sonargraph-Enterprise is designed to allow stake-holders to track important software quality metrics over time. The idea is that this would enable the early detection of harmful trends so that issues can be fixed while they are still easy to fix. The metrics displayed by Sonargraph-Enterprise can be fully customized by the user. However, in this article I will explain the “default” profile that comes with a set of preselected metrics that cover important aspects of code health and quality.
Read MoreCategory: Metrics
Efficiently Track the Quality of a Code Base
Sonargraph offers a wide range of checks for different aspects of software quality: Architecture, metric thresholds, cyclic dependencies, duplicate code, etc.
When Sonargraph gets introduced for software projects that have been developed a couple of years, chances are high that hundred’s of issues are reported. But getting flooded with issues and sifting through them at regular intervals is neither efficient nor really helpful. Instead, you want to get a quick overview whether or not the quality is going into the right direction.
And this is where quality gates come into the game: they allow focussing on the information important to you.
This blog post details how this functionality is implemented in Sonargraph.
Read MoreAnalyzing Software with Advanced Visualizations
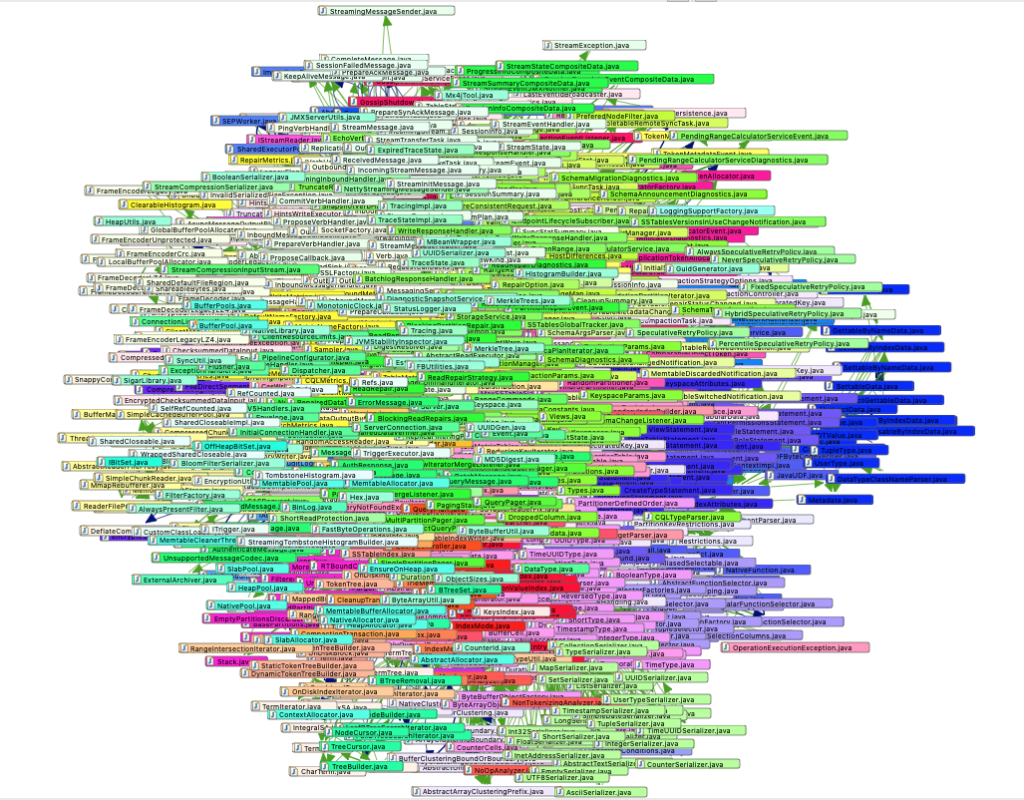
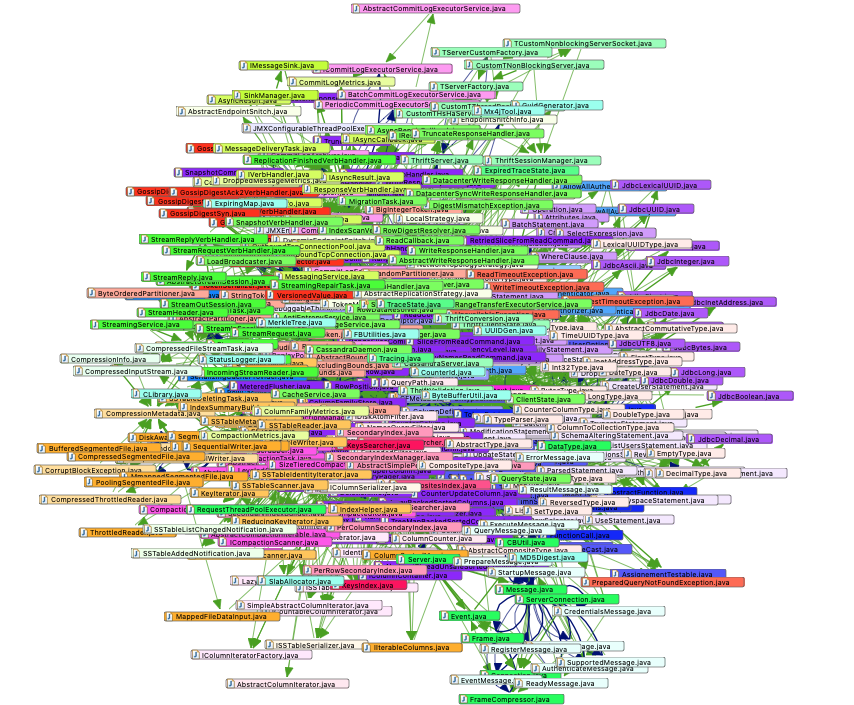
I thought I’d use our new 3D city view visualizations to have a closer look at Apache-Cassandra, a very popular and successful open source project that implements a NoSql database. I know from previous analysis runs of the same software that it already had problems with structural erosion. Years ago I analyzed Cassandra 1.2.6 and found pretty big cycle groups for Java files as well as for packages. Maintainability Level was only 9.4% (everything under 50% is concerning) while the metric “Propagation Cost” has a value of 62%. That means that every change will affect 62% of all code directly or indirectly which also is not a good thing because it significantly increases the chance of regression bugs.
Before you say “this image is useless, you cannot see anything there” let me tell you that I agree. The point is to make sure that your software never ends up in that situation. This big cyclic conglomeration is making it close to impossible to modularize Cassandra or to put any kind of architectural model on top of it.
Read MoreGolden Rules for Sonargraph Newbies
This article will explain how to maximize the benefits of using Sonargraph in day to day development operations. One major benefit is to stop and reverse architectural decay, but Sonargraph can also help to limit complexity and find actual problems in the code.
Read MoreImplementing Additional Metrics Using the Sonargraph Script API
With the Sonargraph 9.10 release, we added support for two additional OO-metrics “Depth of Inheritance” and “Number of Children” as described by Chidamber and Kemerer. Sonargraph provides a powerful Script API that allows implementing new metrics as Groovy scripts and I needed surprisingly little amount of code for the implementation. This blog post will explain the scripts’ code and the used Sonargraph Script API in detail.
Read MoreA Promising New Metric To Track Maintainability
A good metric to measure software maintainability is the holy grail of software metrics. What we would like to achieve with such a metric is that its values more or less conform with the developers own judgement of the maintainability of their software system. If that would succeed we could track that metric in our nightly builds and use it like the canary in the coal mine. If values deteriorate it is time for a refactoring. We could also use it to compare the health of all the software systems within an organization. And it could help to make decisions about whether it is cheaper to rewrite a piece of software from scratch instead of trying to refactor it.
Read More